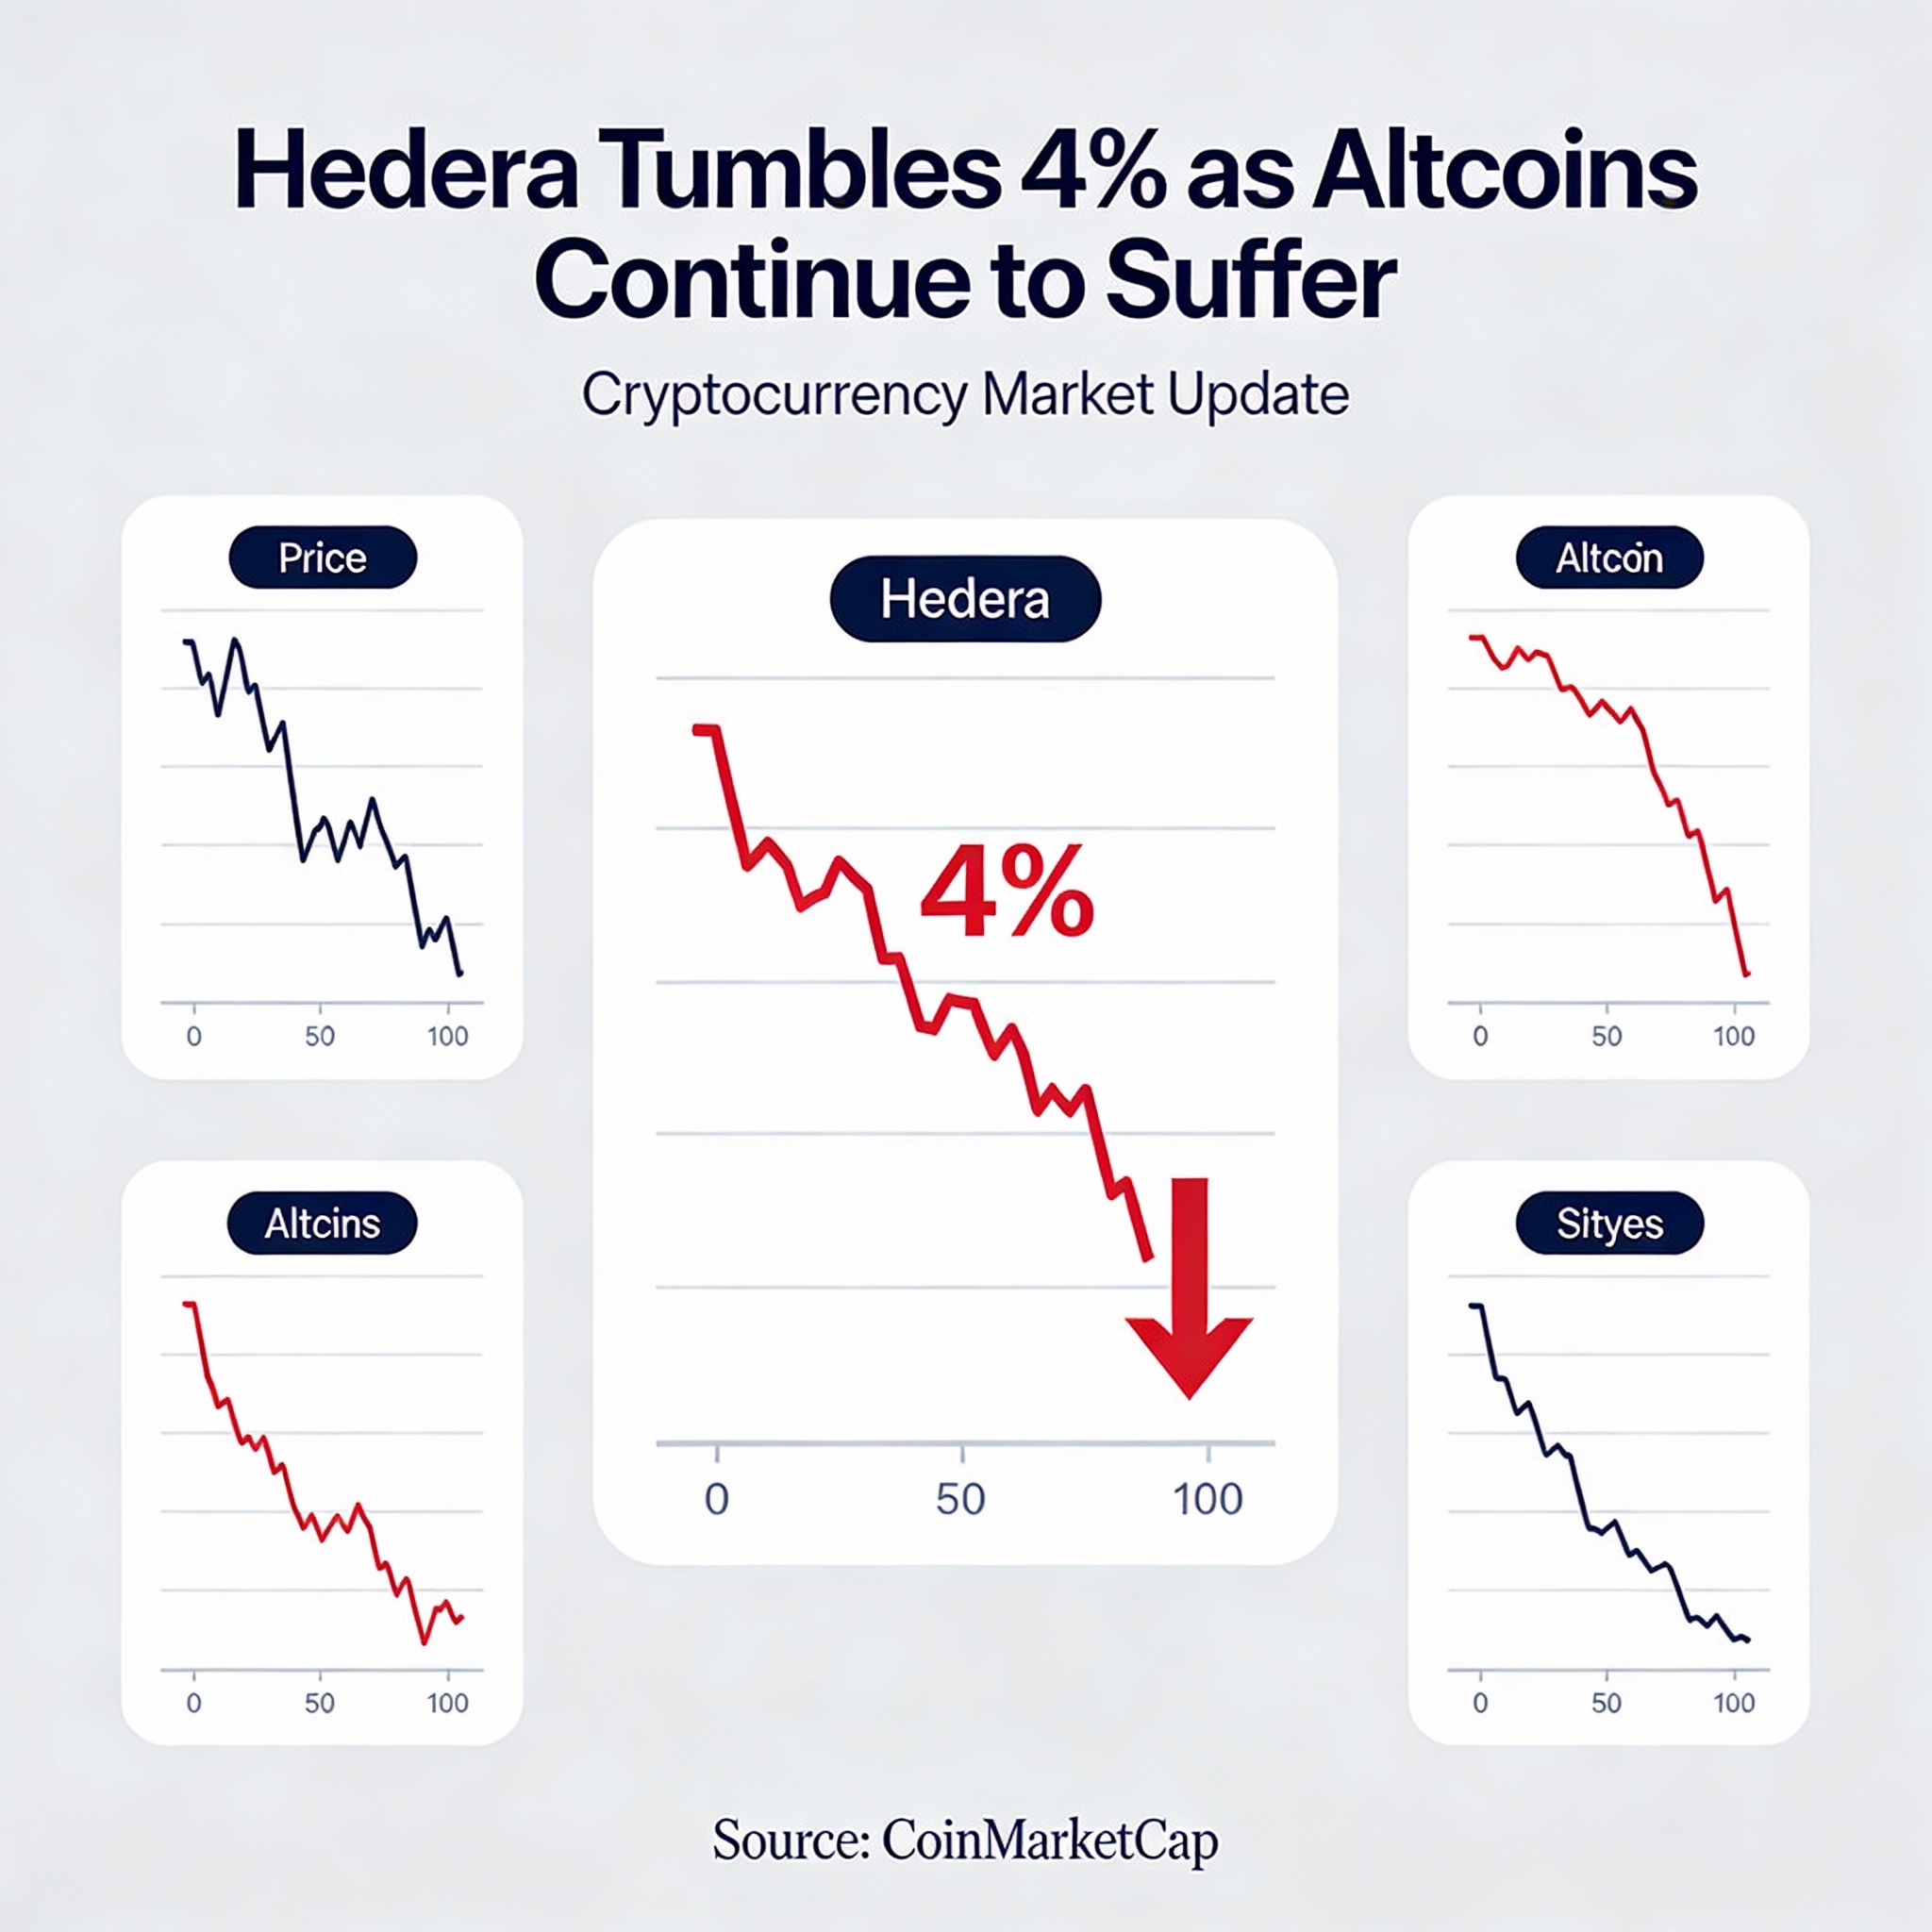
Hedera’s HBAR weakened on Thursday after sellers stepped in near a major resistance zone, with elevated volume driving a decisive afternoon reversal.
The token declined 4% to $0.1247 as a late-session selloff cut through multiple technical levels, reversing earlier gains. HBAR recorded a $0.0082 intraday move—about 6.4% volatility—after repeated failures to clear resistance at $0.1320.
Trading volumes expanded sharply across the session, underscoring broad participation from institutional players rather than the thin liquidity often seen in smaller tokens. The sustained activity points to genuine price discovery as positions were adjusted during the downturn.
The afternoon drop confirmed a lower high compared with the Dec. 11 peak, signaling further deterioration in market structure. As momentum turned lower, HBAR slipped below previously established support zones, accelerating downside pressure.
Prices have since stabilized near $0.1235, which now stands as an important support level. After a brief capitulation, HBAR consolidated in the $0.124–$0.125 range, leaving scope for a short-term mean reversion toward $0.126.
Even with the stabilization, traders remain cautious. The clean break of higher-timeframe support—combined with unusually strong sell-side volume—suggests conviction-driven selling, limiting near-term upside despite attempts at recovery.
Technical Overview: HBAR Searches for Stability
Support and Resistance
- Immediate support holding around $0.1235 after the decline
- Strong resistance reaffirmed at $0.1320 following multiple rejections
- Short-term consolidation range forming between $0.123 and $0.125 on 60-minute charts
Volume Signals
- Total volume reached 165.9 million tokens, 175% above the 24-hour average
- Hourly flash-crash volume peaked at 15.7 million tokens, roughly 700% above normal
- Elevated activity confirms institutional participation
Chart Structure
- Lower-high pattern from the Dec. 11 peak reinforces a bearish setup
- Flash-crash-and-recovery formation hints at accumulation near support
- Loss of multiple support levels indicates a shift in trend
Targets and Risk
- Near-term upside target at $0.126 on a mean reversion move
- Downside risk toward $0.123 if current support fails
- Key overhead resistance remains at $0.1285, the site of the initial breakdown