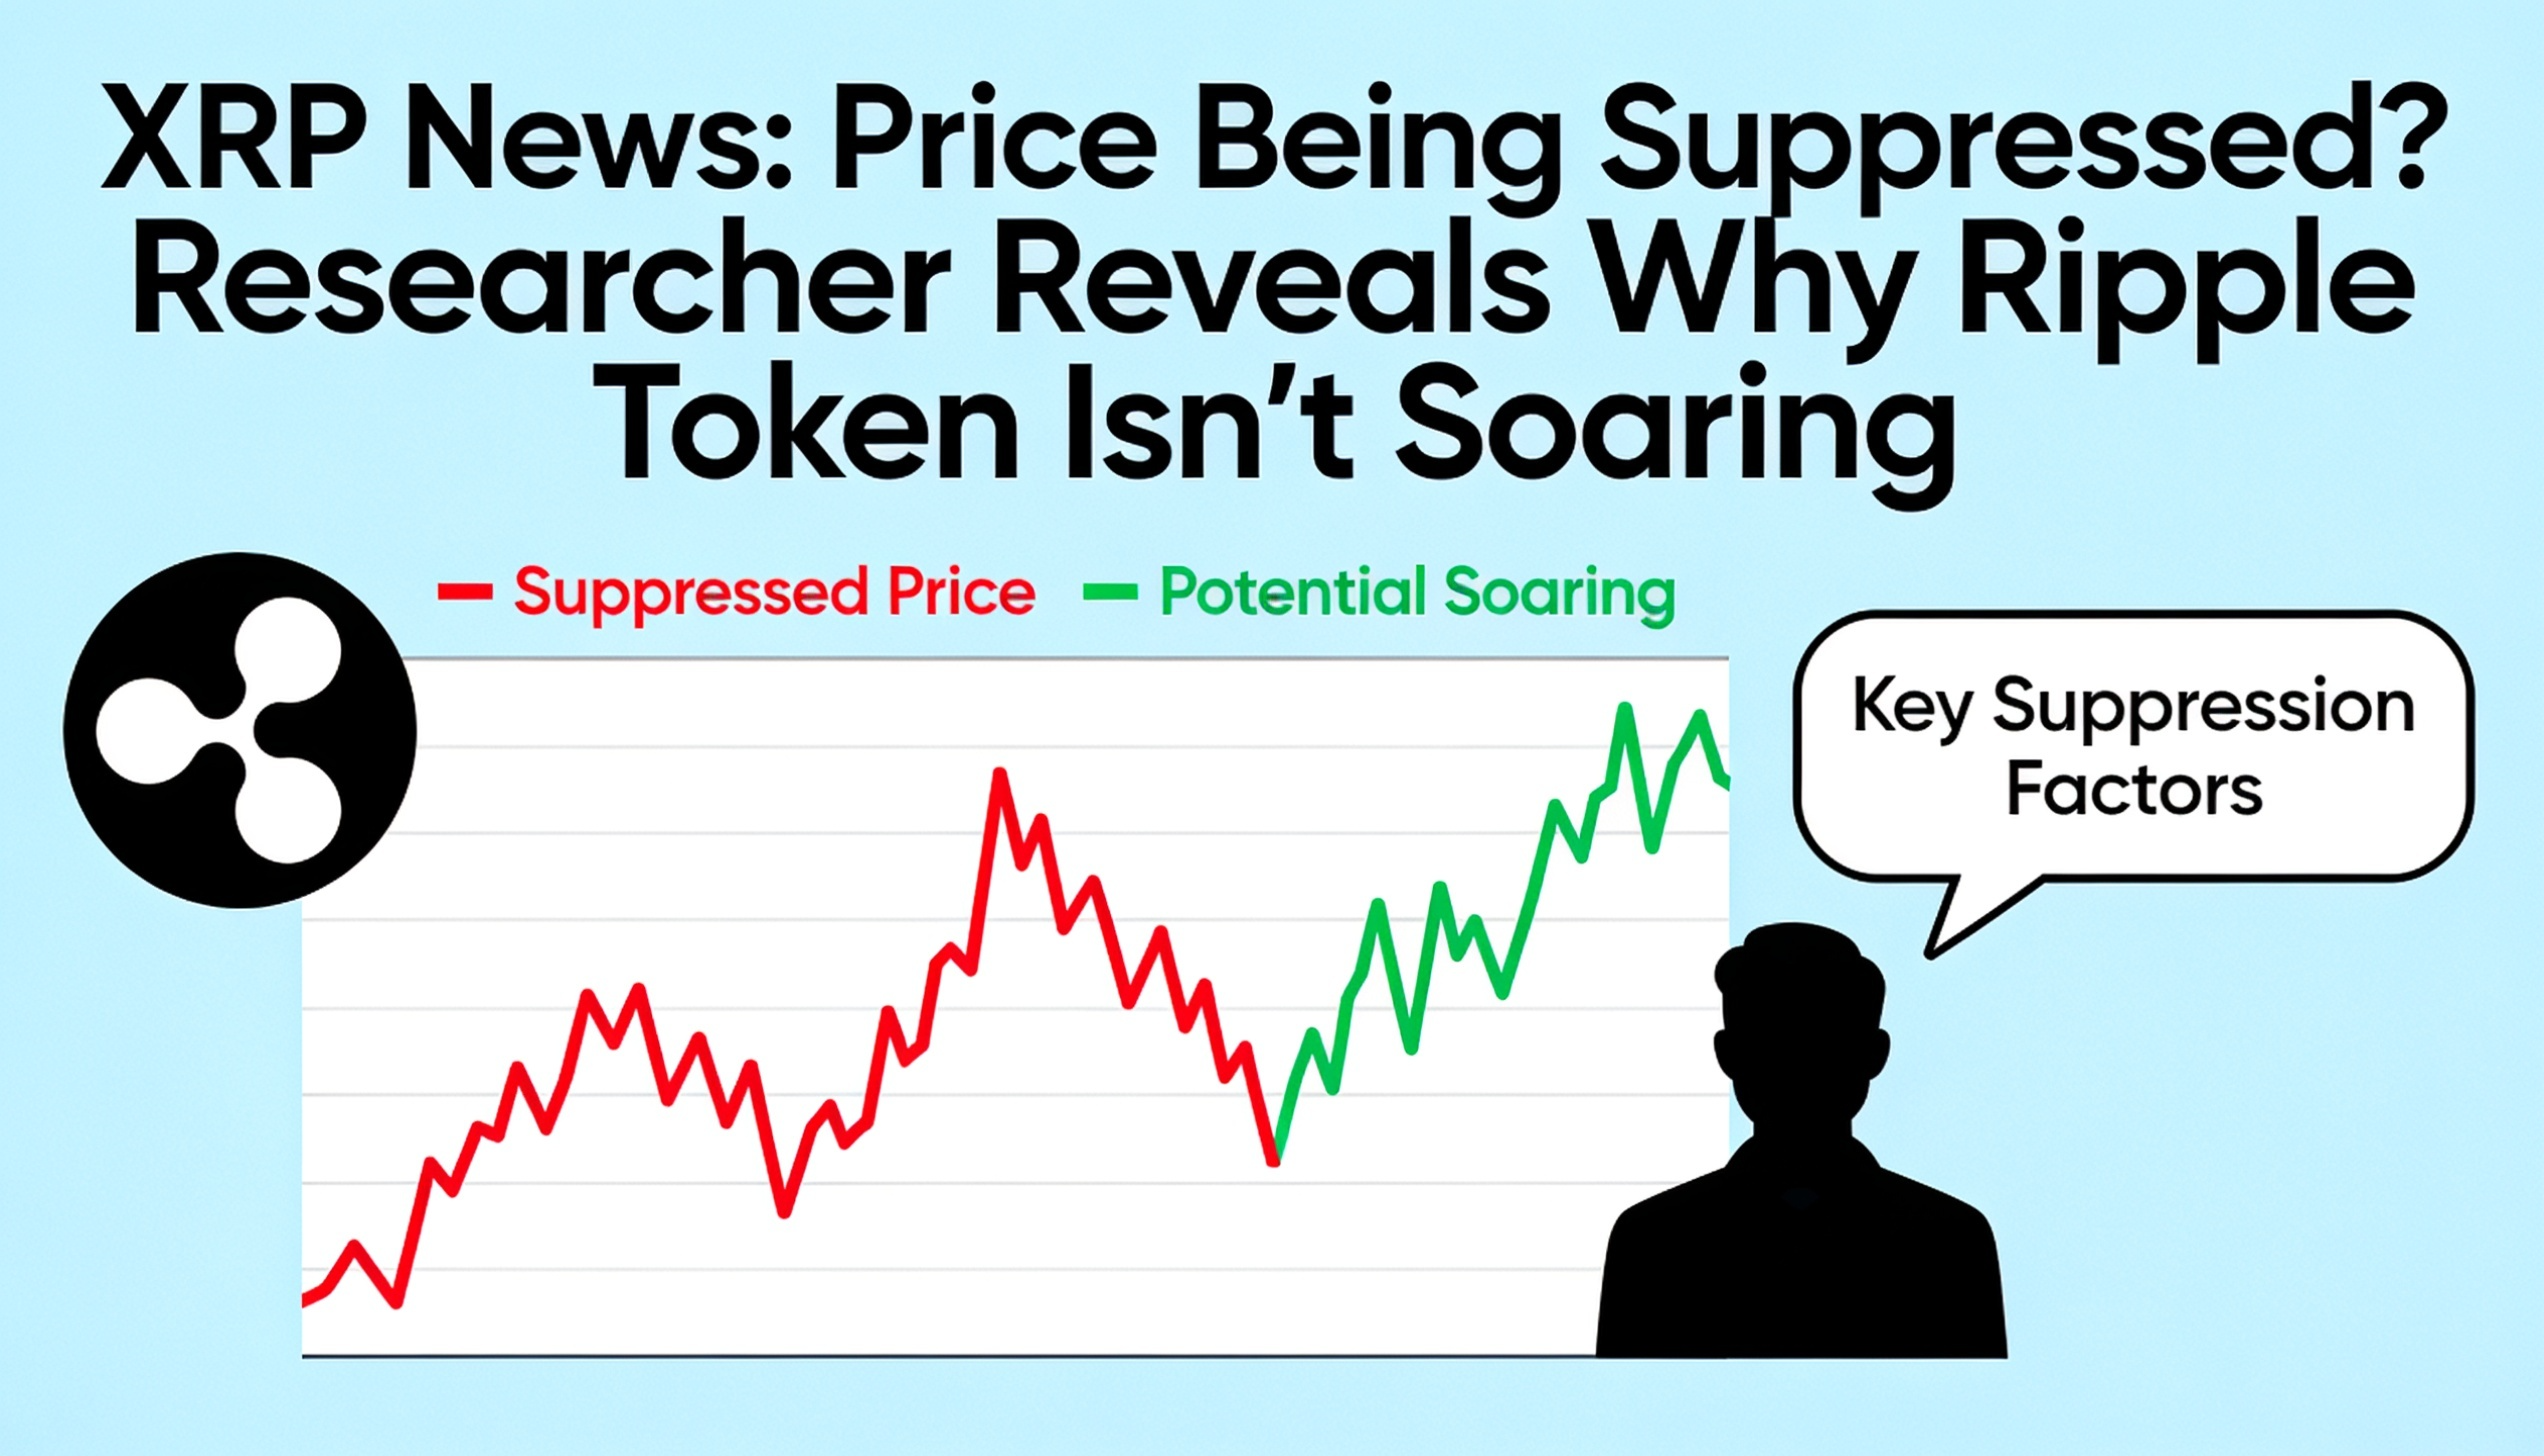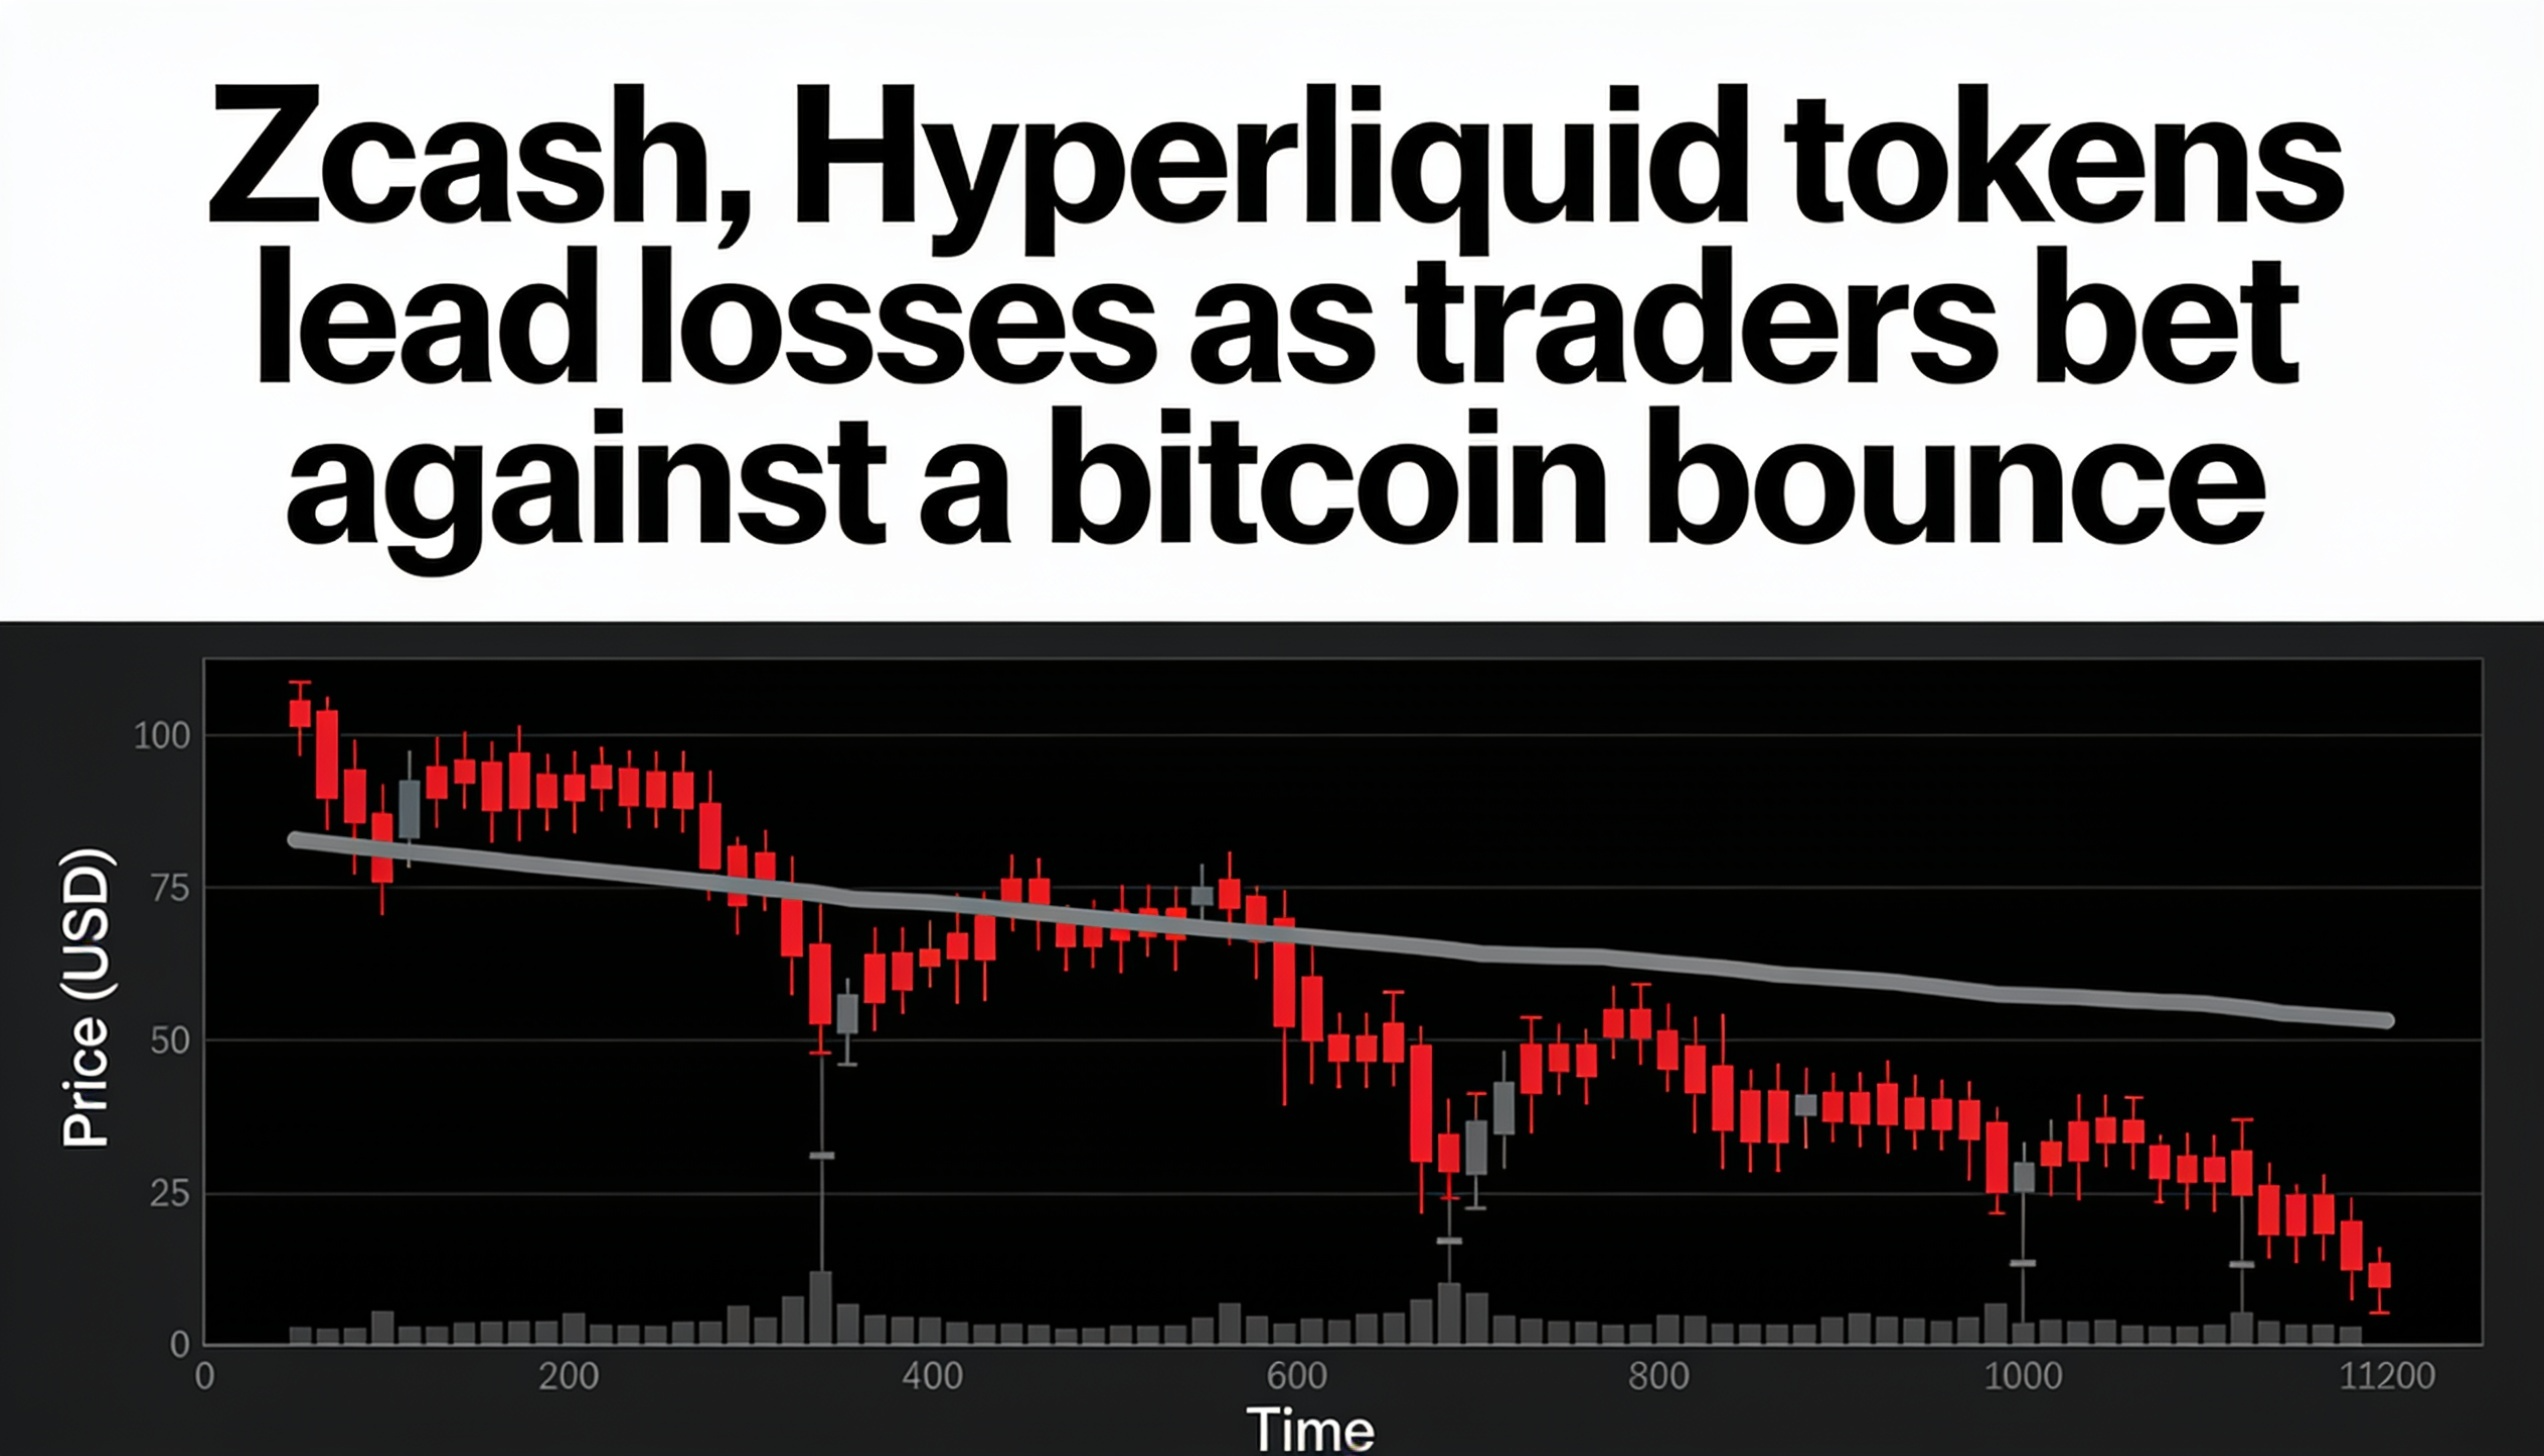
The main question now is whether the current selling pressure starts to stabilize into a reversal base, or whether it continues to dominate price action and drive further downside.
Discover: The Best Crypto to Diversify Your Portfolio
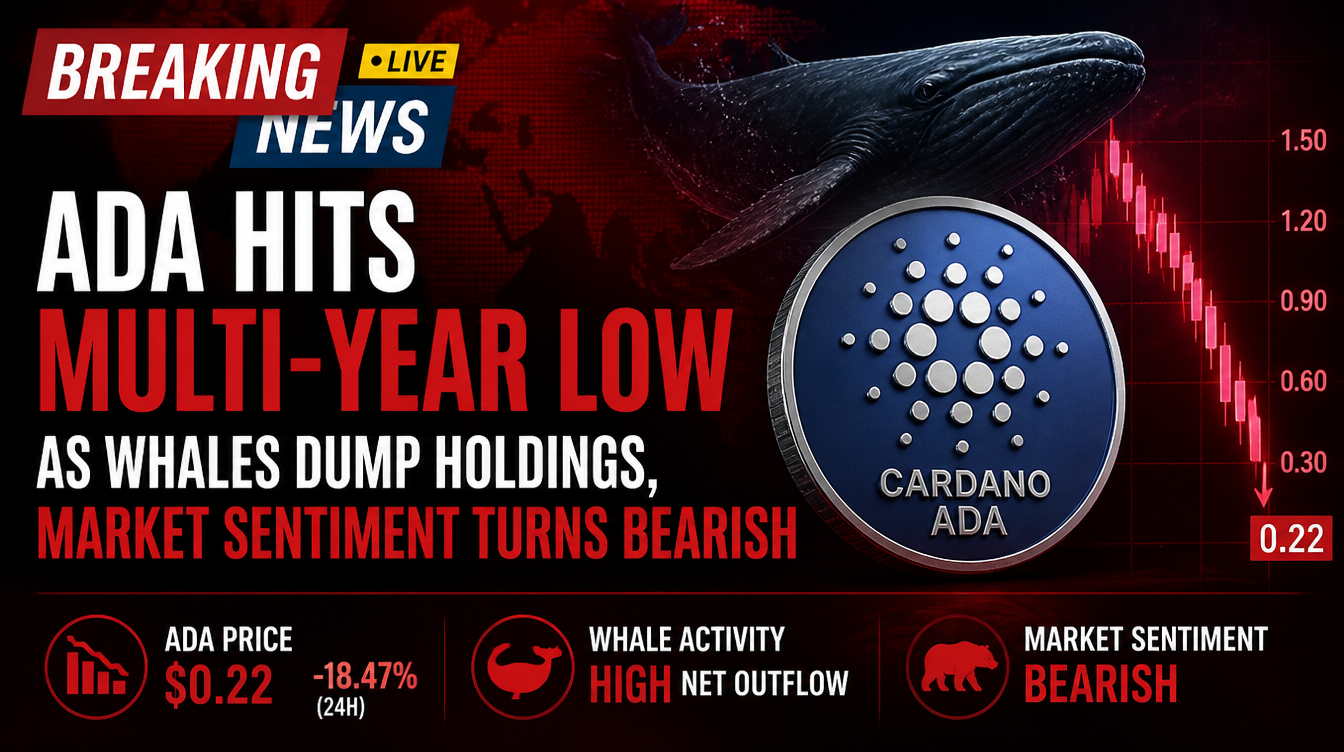
Cardano News: What On-Chain Data and Whale Flows Indicate
Data from Santiment highlights a sharp rise in Cardano’s Age Consumed metric alongside a flattening of Mean Dollar Invested Age as ADA fell toward $0.1485. This combination typically signals that long-dormant coins are being moved, often associated with capitulation or broad redistribution phases rather than ordinary market activity.
Whale activity reinforces this trend. Wallets in the 10–100 million ADA range have reportedly sold around 180 million tokens in a short span, while the 1–10 million ADA cohort previously offloaded more than 560 million tokens over a four-day period.
This distribution is unfolding alongside broader macro weakness. ETF outflows, institutional de-risking, and risk-off sentiment across global markets have added pressure to altcoins, suggesting Cardano’s decline is part of a wider downturn rather than an isolated event.
From a technical perspective, the 50-, 100-, and 200-day EMAs remain stacked between $0.23 and $0.33—well above current price levels. This structure is typically associated with a broken or deeply weakened trend rather than a healthy correction.
Cardano Price Prediction: Where ADA Could Be Headed
Over the past two years, Cardano has experienced a full boom-and-bust cycle on the weekly timeframe. After trading in a range between $0.35 and $0.50 through mid-2024, ADA surged in late 2024, reaching a peak near $1.35–$1.40 in early 2025.
This rally was followed by a sustained pattern of lower highs and heightened volatility throughout 2025. Since mid-year, ADA has been in a steady downtrend, erasing most of its gains and recently touching lows around $0.1666. As of June 11, 2026, the token trades near that level, slightly higher on the week but still sitting near the bottom of a long descending channel.
Momentum indicators remain weak, with the RSI (14) at approximately 27.83, deep in oversold territory. While this may open the door for a short-term relief bounce or consolidation, the broader structure remains firmly bearish. Price action has now revisited levels last seen during previous bear market conditions, underscoring the depth of the retracement from its 2025 highs.