

Ether Extends Its Lead Over Bitcoin, Stirring Fresh Bullish Expectations
Ether (ETH) is displaying uncommon strength against bitcoin (BTC) on a day when broader market sentiment is leaning bearish—a dynamic that rarely occurs during market pullbacks.
Bitcoin has slid more than 2% to near $97,200, yet ether is holding firm around $3,230, according to CoinDesk data. This divergence has pushed the ETH/BTC ratio higher by over 2%, signaling a clear shift in relative momentum toward ether.
Below are three charts helping define the current market picture:
ETH/BTC Ratio
On Binance, the ETH/BTC pair remains confined within a mildly downward-sloping counter-trend channel, representing a consolidation phase after the sharp May–August advance. The gentle slope suggests the pair is simply cooling off rather than entering a deeper bearish trend.
A decisive breakout above the channel would affirm renewed capital rotation into ether and hint at continued upside for the ratio. Supporting this view, the MACD histogram is close to turning positive—an early sign that bullish momentum may be building.
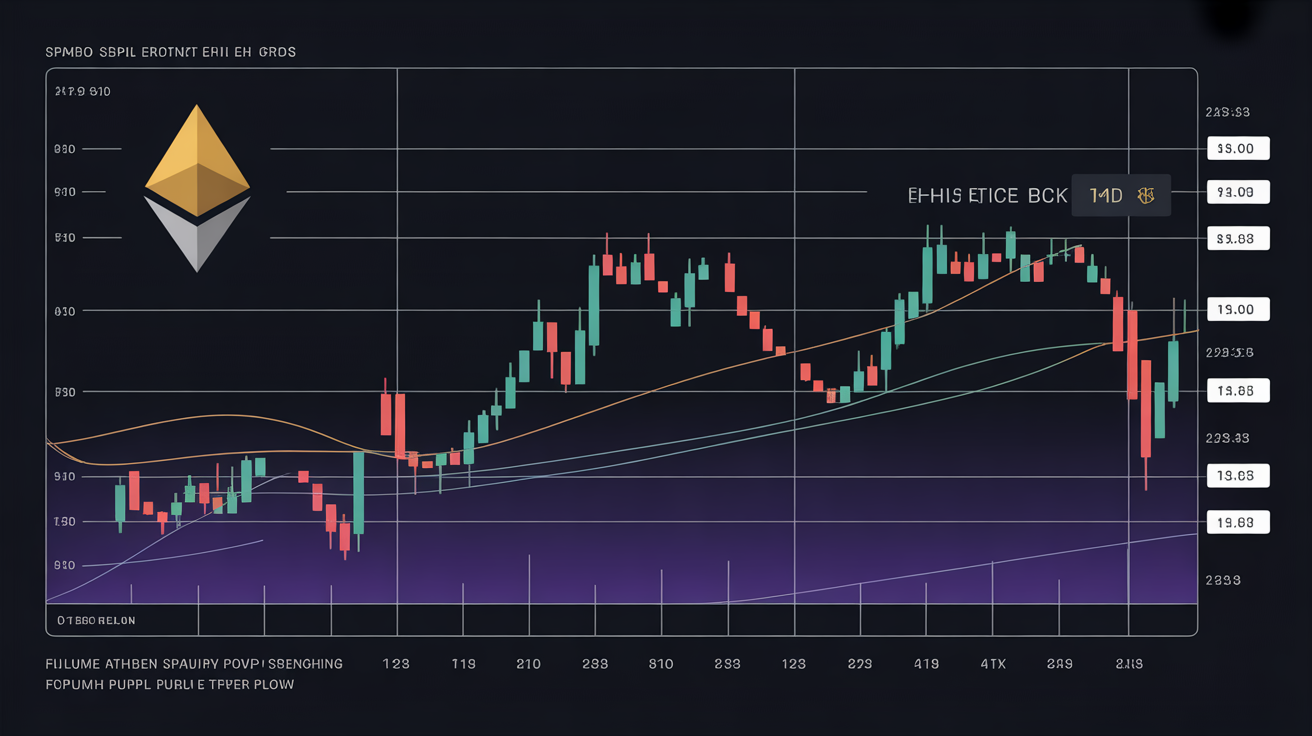
Ether (USD Pair)
Ether’s dollar chart mirrors the ETH/BTC pattern. The price continues to track within a downward channel, but repeated long lower wicks around the $3,000 level signal fading seller pressure and early signs of a potential reversal.
Still, a confirmed breakout above the top of the channel is necessary to establish a broader bullish shift in structure.
XRP/BTC Ratio
A strong move in ether often sets the tone for the wider altcoin market, and XRP appears particularly well-positioned. The XRP/BTC ratio has been compressing within a multi-year range, coiling tightly in preparation for a significant move.
A breakout in ether could be the catalyst that finally pushes XRP/BTC upward, potentially unlocking substantial upside momentum.