
Bitcoin’s Monthly MACD Signals Bearish Shift
Bitcoin (BTC) has turned bearish on its monthly MACD histogram, printing its first red bar below zero in November as prices dropped over 17%. The reading suggests the recent bull run from around $20,000 has ended, with bears now in control.
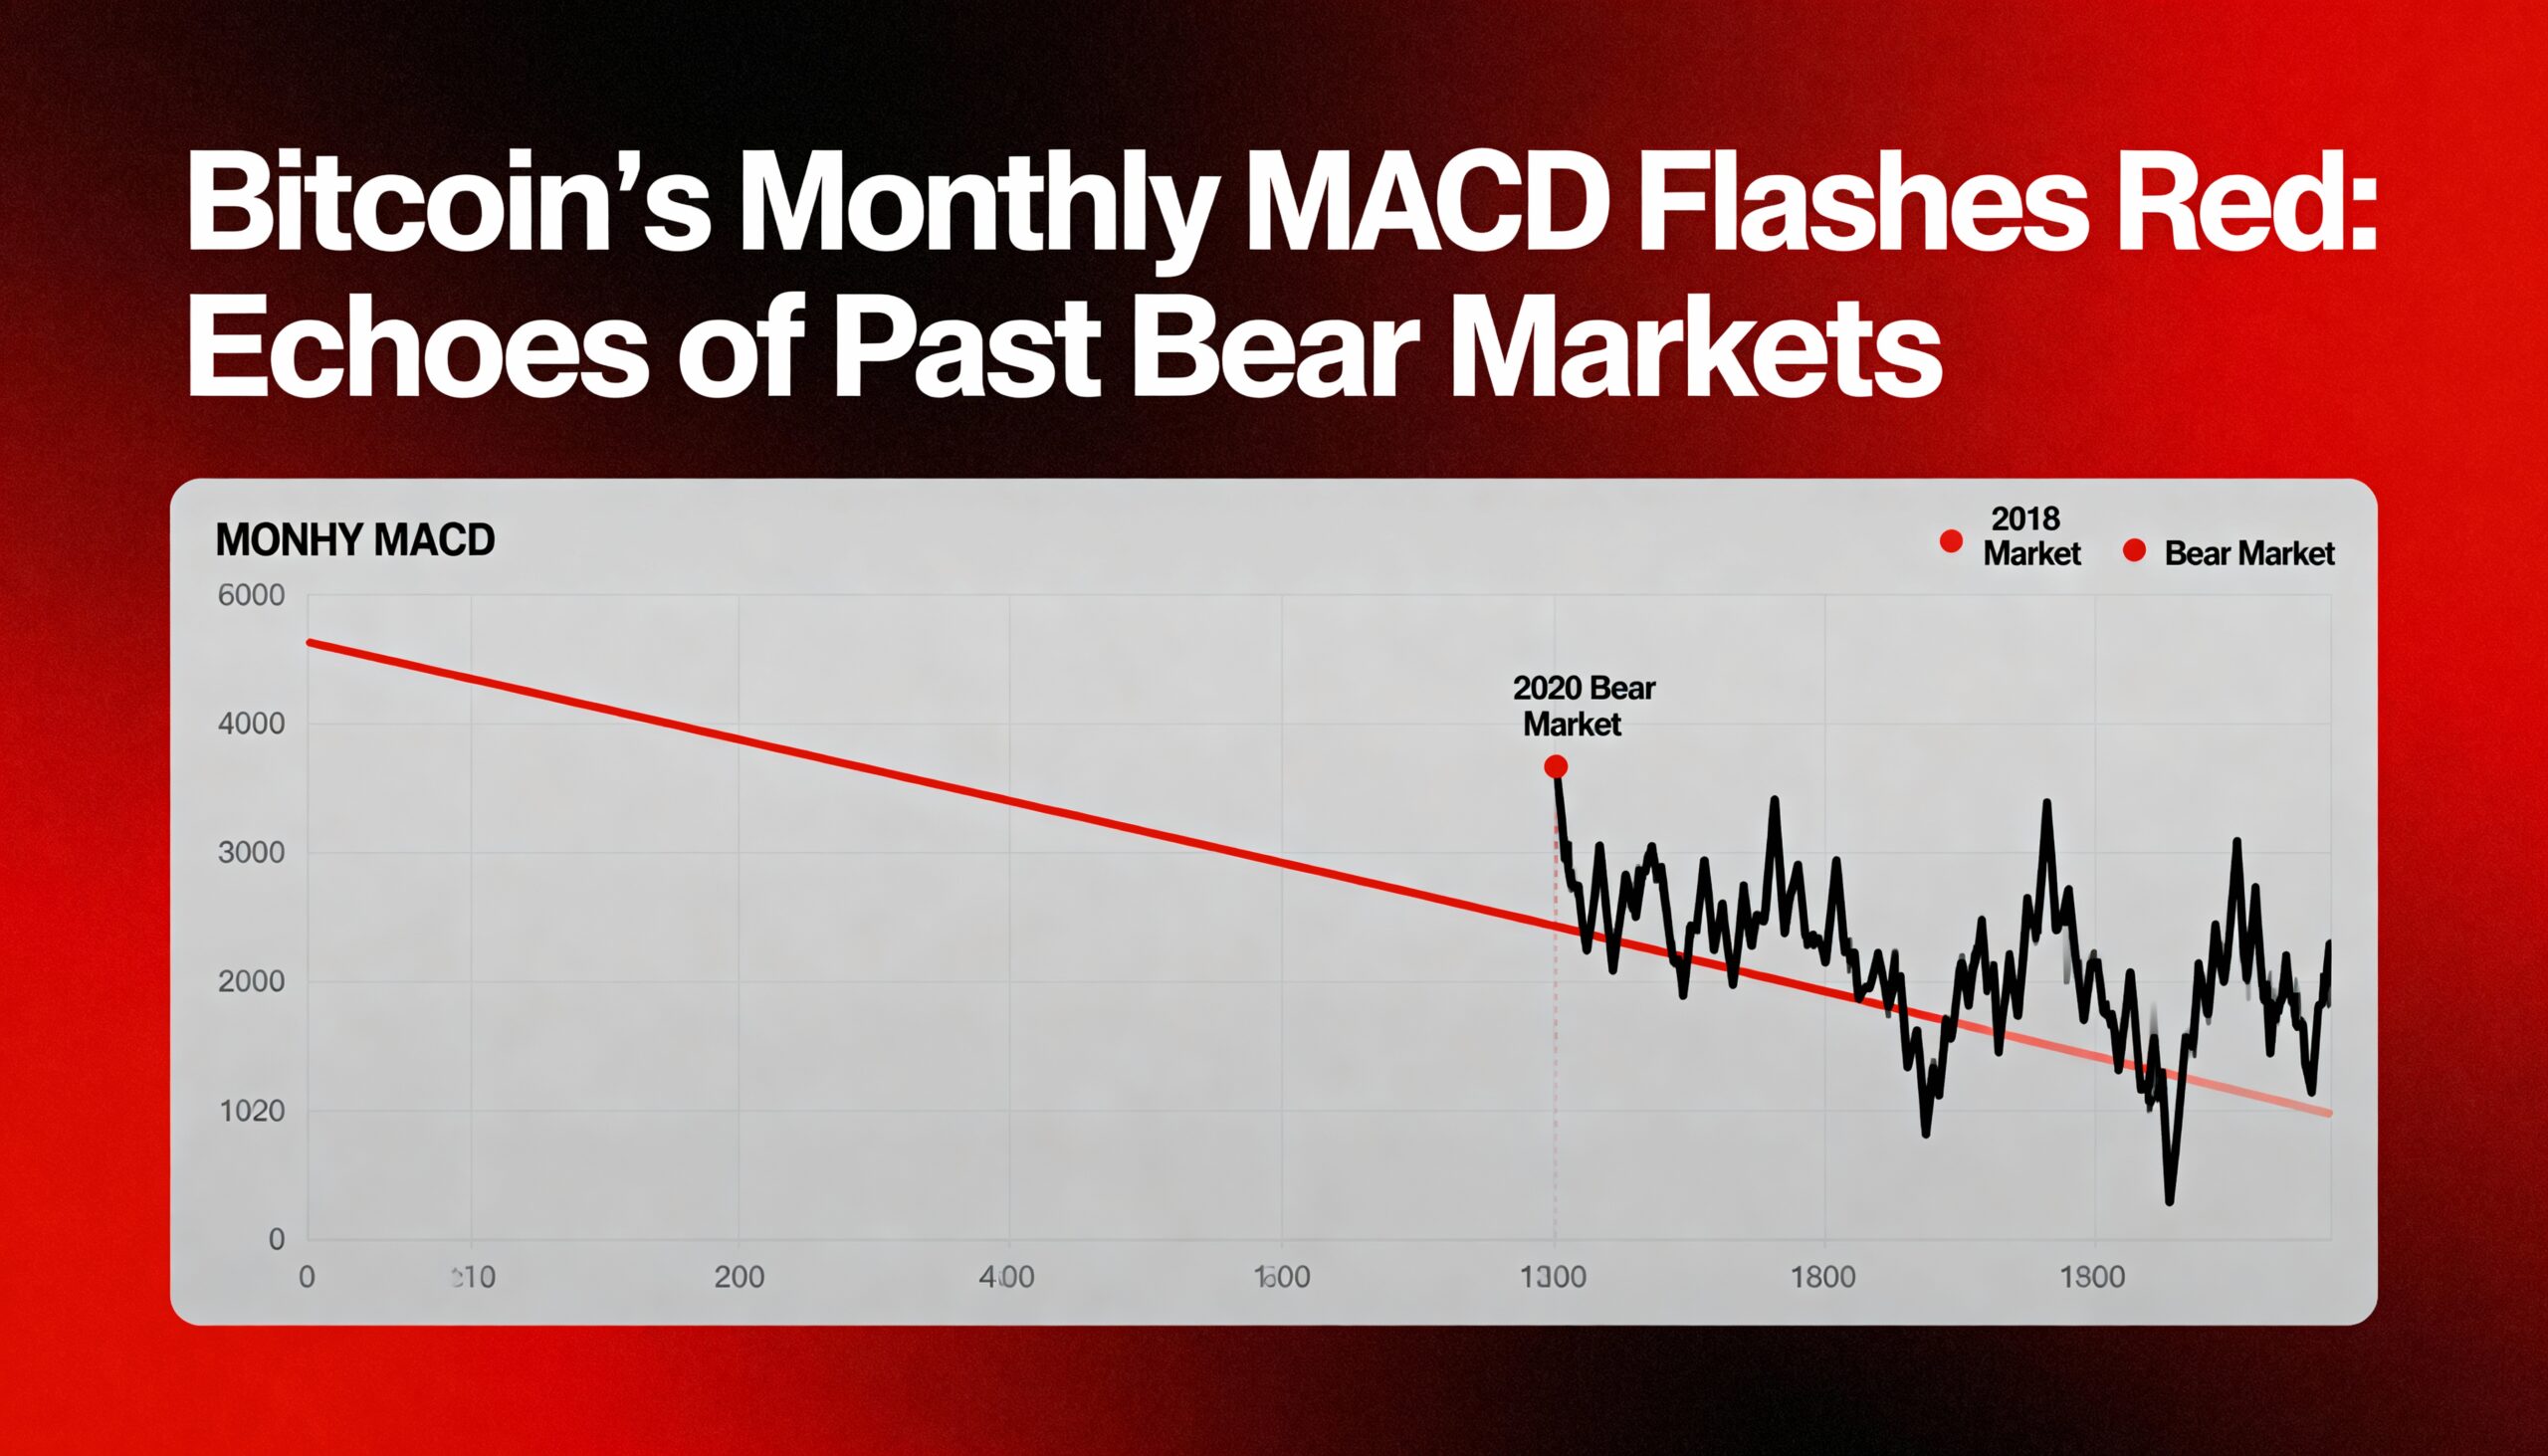
Historically, bearish MACD crossovers have often preceded deeper corrections. Following BTC’s decline from $70,000 to $50,000 in late 2021, the MACD turned negative in January 2022, foreshadowing further drops below $20,000. Similar patterns occurred in 2018 and 2014.
Macro headwinds—including Japan’s fiscal strain, a strong dollar index, resilient Treasury yields, and spot ETF outflows—reinforce the bearish outlook. Key support sits at $84,500, with downside targets at April’s $74,500 low and the 2021 peak near $70,000 if breached.
Ethereum (ETH) also shows caution, with a confirmed death cross signaling short-term weakness, though its track record as a predictive tool is mixed.


Leave a Reply