


Bitcoin’s realized cap stabilization, elevated RHODL ratio, and persistently negative funding rates are increasingly being interpreted as signs that a cycle bottom may have formed earlier this year.
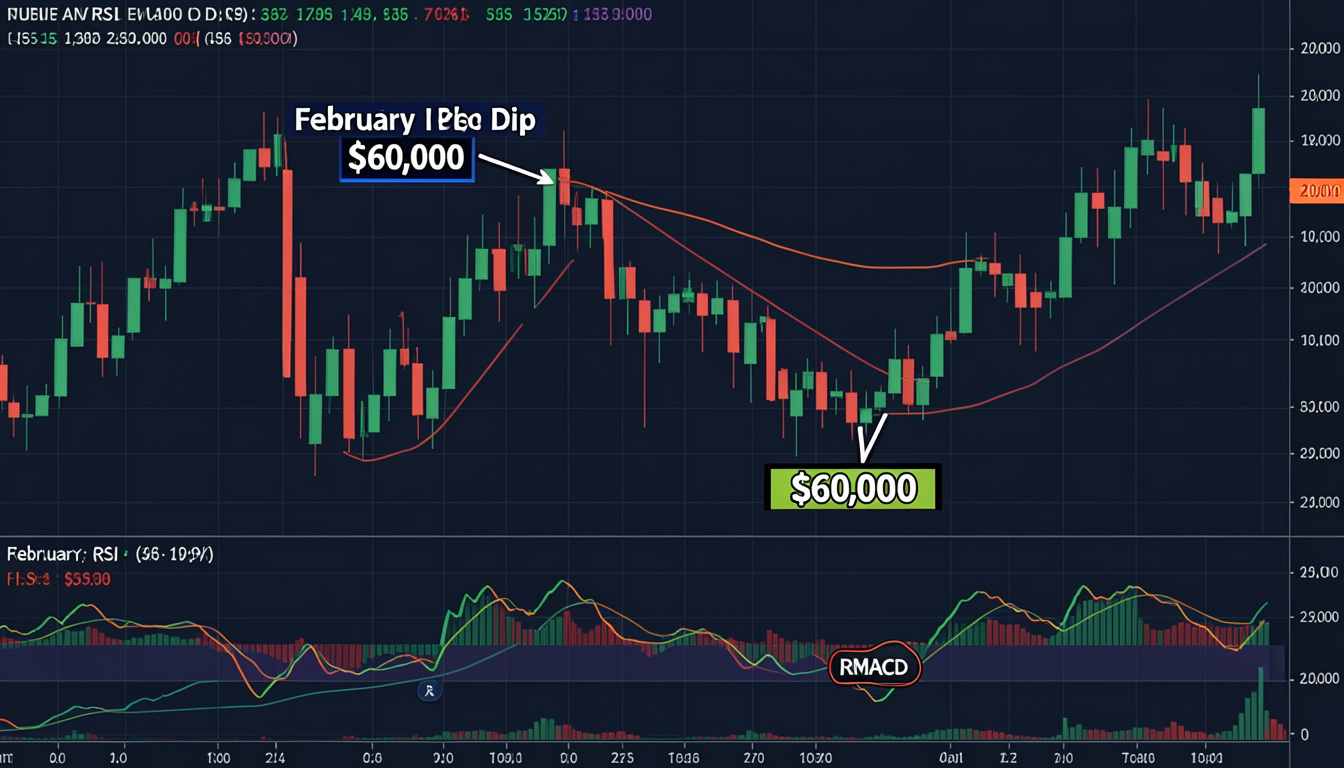
For Bitcoin (BTC) investors, the key debate is whether the market already printed its low in early February, when prices briefly slid toward $60,000 during a sharp correction. While no single metric can confirm a definitive bottom, a growing cluster of on-chain and derivatives indicators suggests the worst of the downturn may be behind us, particularly as BTC now trades back above $77,000.
One of the most closely watched signals is Realized Cap, which values Bitcoin based on the price at which each coin last moved on-chain. Unlike market capitalization, which reflects the current spot price, Realized Cap represents the aggregate cost basis of holders and is widely used to track capital inflows and outflows across the network.
Realized Cap peaked near $1.12 trillion before sliding to roughly $1.08 trillion as Bitcoin fell more than 50% from its October all-time high. The decline reflected one of the largest wealth drawdowns in Bitcoin’s history. However, the metric has since stabilized, showing early signs of base-building behavior similar to previous major cycle lows, including the 2022 bear market bottom.
Another key indicator is the RHODL Ratio, which compares wealth held by longer-term holders (six months to two years) with that of newer market participants (one day to three months). The ratio currently sits above 5, its third-highest reading on record. Historically, only the 2015 and 2022 cycle bottoms produced higher levels, suggesting long-term holders continue to dominate supply. Since February, this cohort has accumulated more than 400,000 BTC.
Derivatives positioning adds further context. Perpetual futures funding rates—the payments exchanged between long and short traders to keep futures prices aligned with spot—remained deeply negative for an extended period between February and May. Prolonged negative funding typically reflects extreme bearish sentiment and crowded short positioning, conditions that often appear near market bottoms as downside pressure becomes exhausted.
Similar setups have previously emerged around major macro stress events, including the Silicon Valley Bank crisis in March 2023, the yen carry trade unwind in August 2024, and the tariff-driven selloff in April 2025—all of which ultimately coincided with significant Bitcoin lows and subsequent recoveries.