


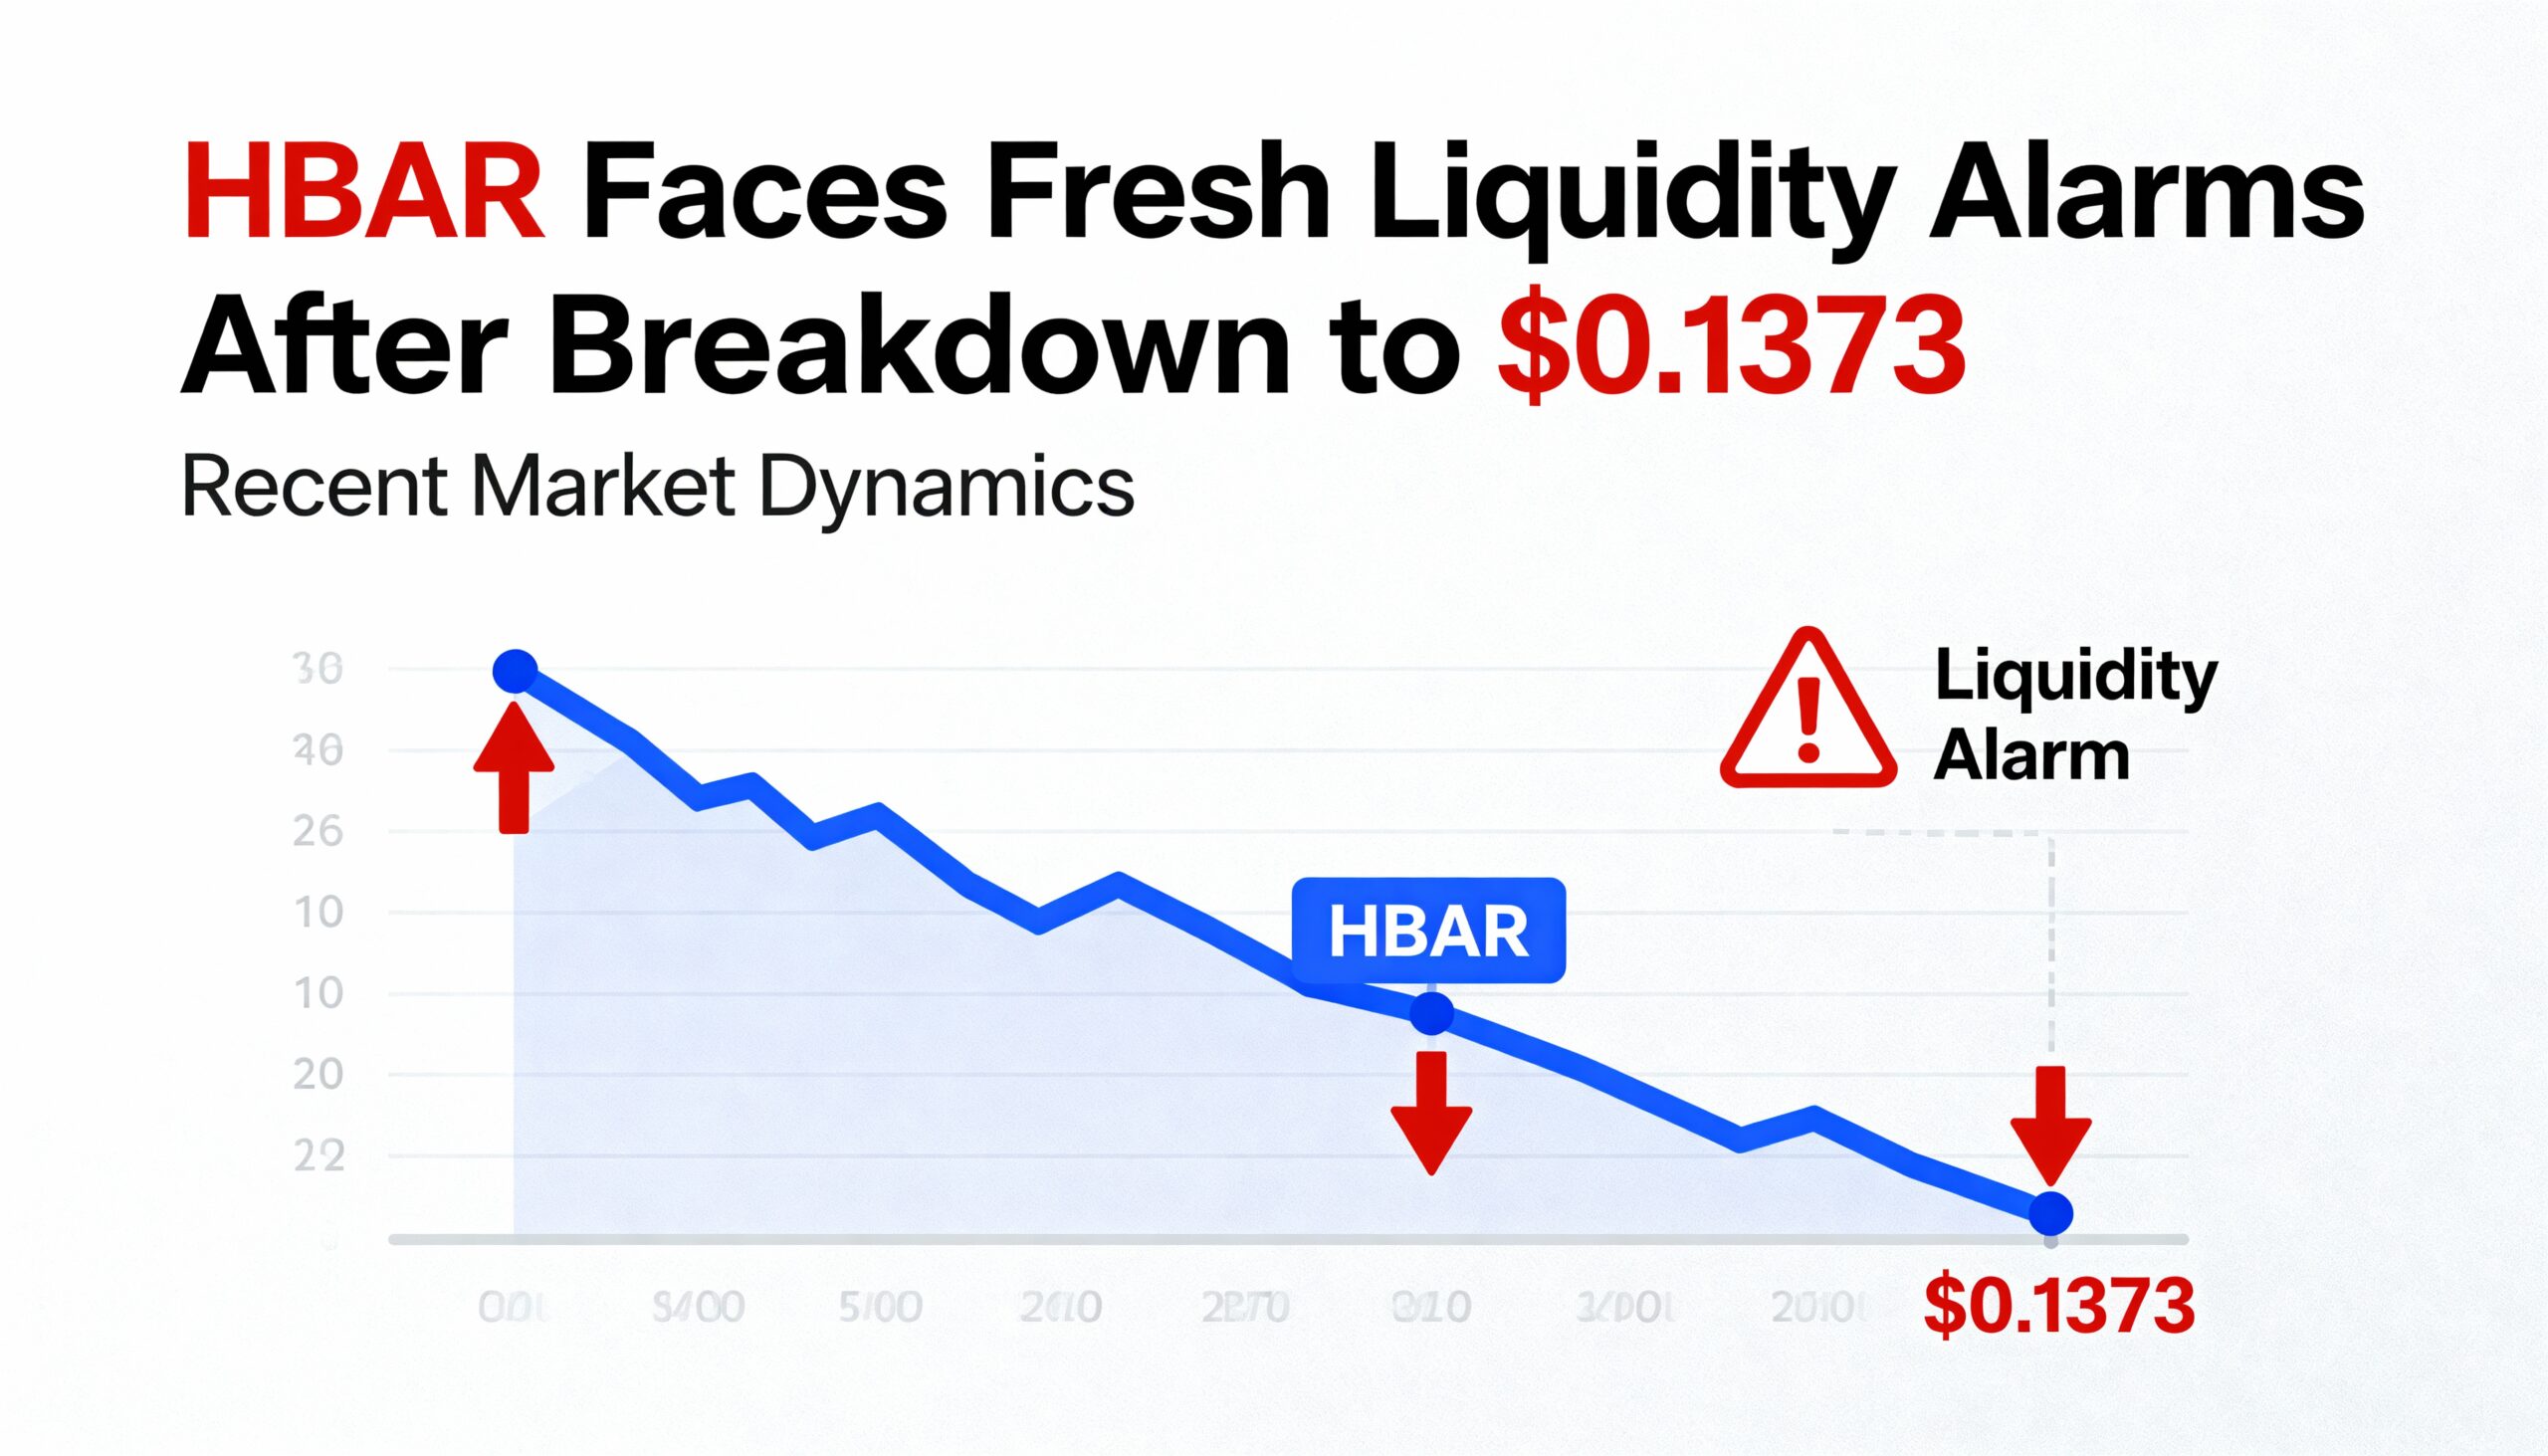
Hedera’s HBAR token faced renewed selling pressure after slipping beneath a key support zone, as a late-session trading freeze, fading volume, and unsuccessful rebound attempts highlighted deepening liquidity and structural weaknesses.
HBAR declined to $0.1373, marking a clean break below its important $0.145 support after buyers failed to maintain control of the recent consolidation range. The final-hour downturn signaled a clear transition from a neutral trading profile to a bearish structure, with momentum steadily deteriorating into the session close.
Conditions worsened sharply near the end of trading. A sudden halt between 14:12 and 14:14—during which no trades occurred—raised concerns about potential structural instability or an acute liquidity shortage. Such disruptions can accelerate declines when markets are already under strain.
Earlier in the day, a 138% jump in volume revealed firm resistance around $0.1486. Although HBAR briefly bounced in a V-shaped recovery from its $0.1382 intraday low, buying strength faded quickly, leaving the token exposed to the subsequent breakdown.
Technical Signals Point to Increasing Downside Risk
Support & Resistance Structure
- The $0.1382 support level is now a crucial downside marker following the collapse of the consolidation zone.
- The previous $0.1445 support is expected to flip into resistance on any attempted rebound.
- Heavy resistance persists at $0.1486, where heightened volume earlier marked a strong rejection.
Volume Trends
- A spike to 146.94 million tokens—138% above the 61.8 million average—suggests distribution by sellers.
- A sharp drop to only 9.76 million tokens occurred just ahead of the breakdown.
- The zero-volume trading halt underscores severe short-term liquidity stress.
Chart Formation
- The consolidation zone between $0.1446 and $0.1477 has been invalidated by the bearish break.
- The initial V-shaped recovery from $0.1382 failed to develop into a sustained uptrend.
- A daily trading range of $0.0096 (6.5%) reflects elevated volatility conditions.
Risk/Reward Outlook
- Continued weakness below $0.1440 shifts focus toward a retest of the $0.1382 support level.
- Immediate resistance is expected at the former $0.1445 support on any recovery attempt.
- The temporary trading suspension raises broader questions about market depth and liquidity integrity.