


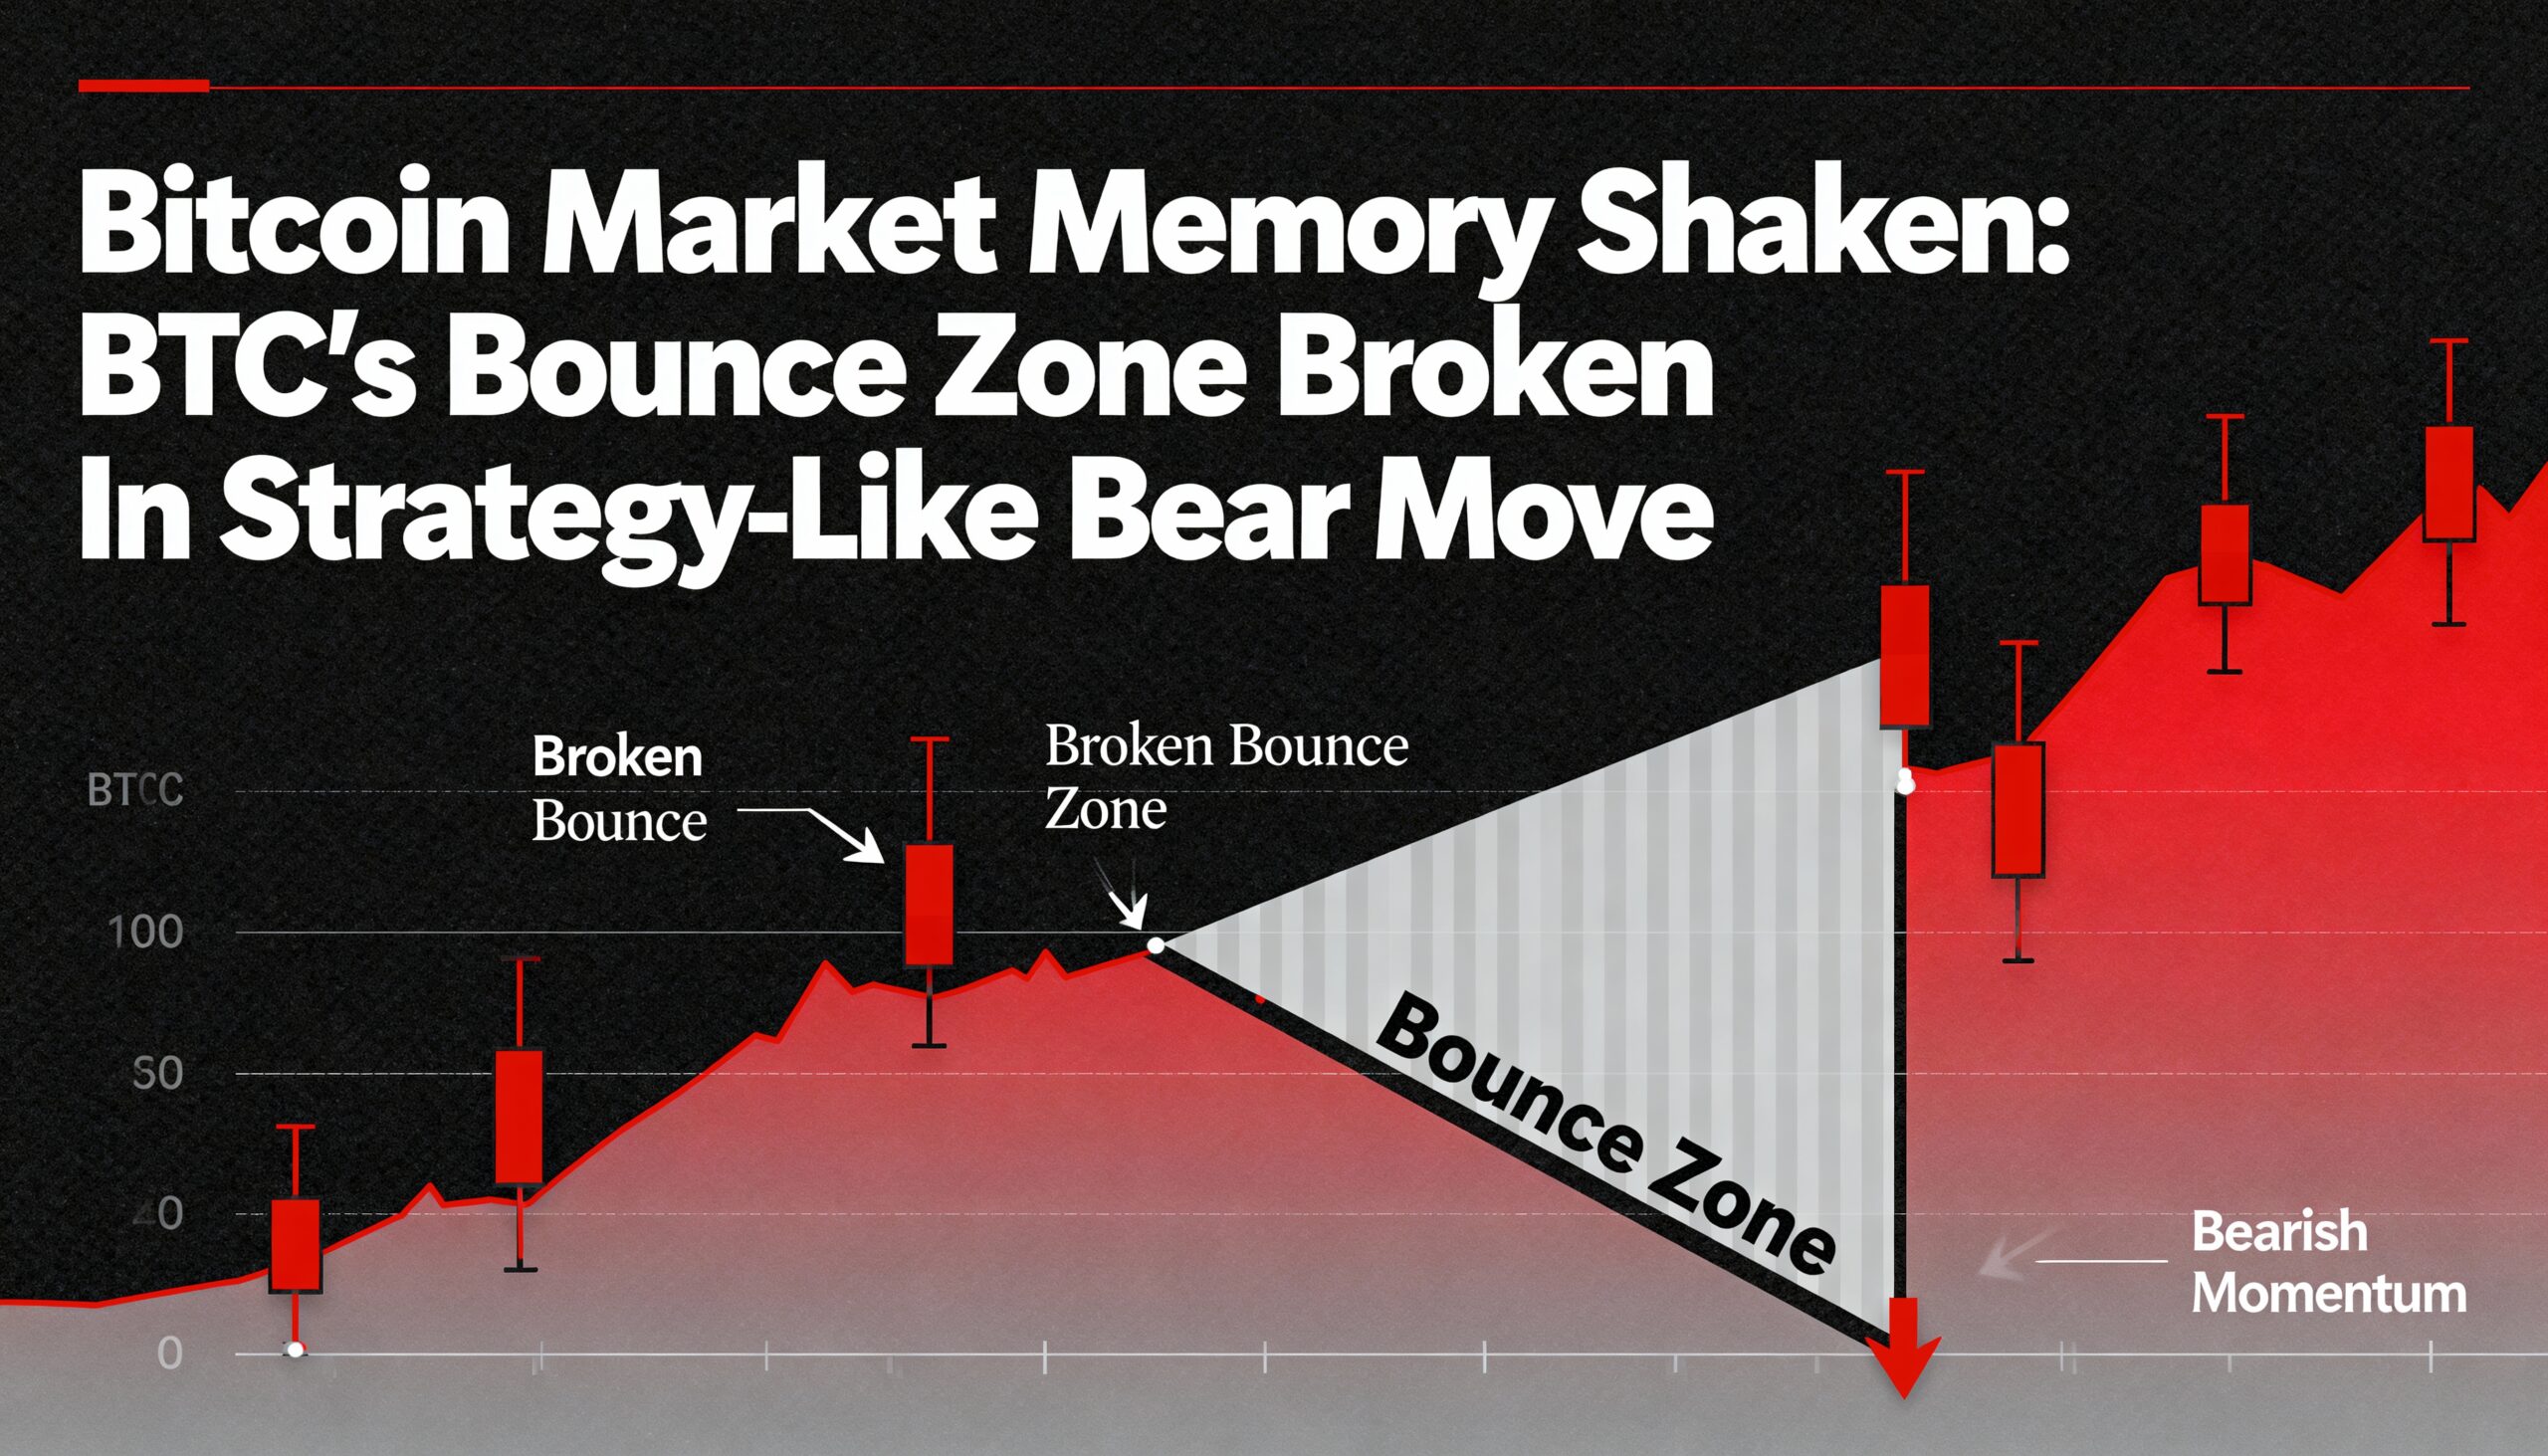
Bitcoin has broken below a major long-term support level, disrupting a bullish structure that traders have leaned on for nearly two years and raising the risk of a deeper, sentiment-driven sell-off.
BTC, recently priced around $90,091.77, slid nearly 10% during the week ending Nov. 16. The move produced a strong bearish weekly candle that closed well under the 50-week simple moving average (SMA), TradingView data shows.
This breakdown marks more than just a technical violation. The 50-week SMA had repeatedly served as Bitcoin’s “memory zone” for dip buyers since early 2023, functioning as a dynamic floor during multiple market pullbacks. Its failure now signals a shift from a buy-the-dip environment to one where traders may instead lean toward selling into rebounds.
The market is echoing the trajectory previously seen in Strategy (MSTR). When MSTR lost its long-held 50-week SMA support earlier this year, confidence eroded quickly and selling pressure intensified. CoinDesk highlighted that breach at the time, warning that Bitcoin could face similar implications if it slipped below its own long-term trend line—which is now playing out.
With the support level broken, the 50-week SMA has flipped into resistance. Any recovery rallies are expected to encounter selling interest near the $102,868 mark. Bitcoin would need to secure consistent weekly closes above that area before the broader bullish structure could be considered restored.
Meanwhile, MSTR—the largest public company holding bitcoin—fell beneath its 50-week SMA in September and has continued to slide, recently touching $200, its lowest level since October 2024.