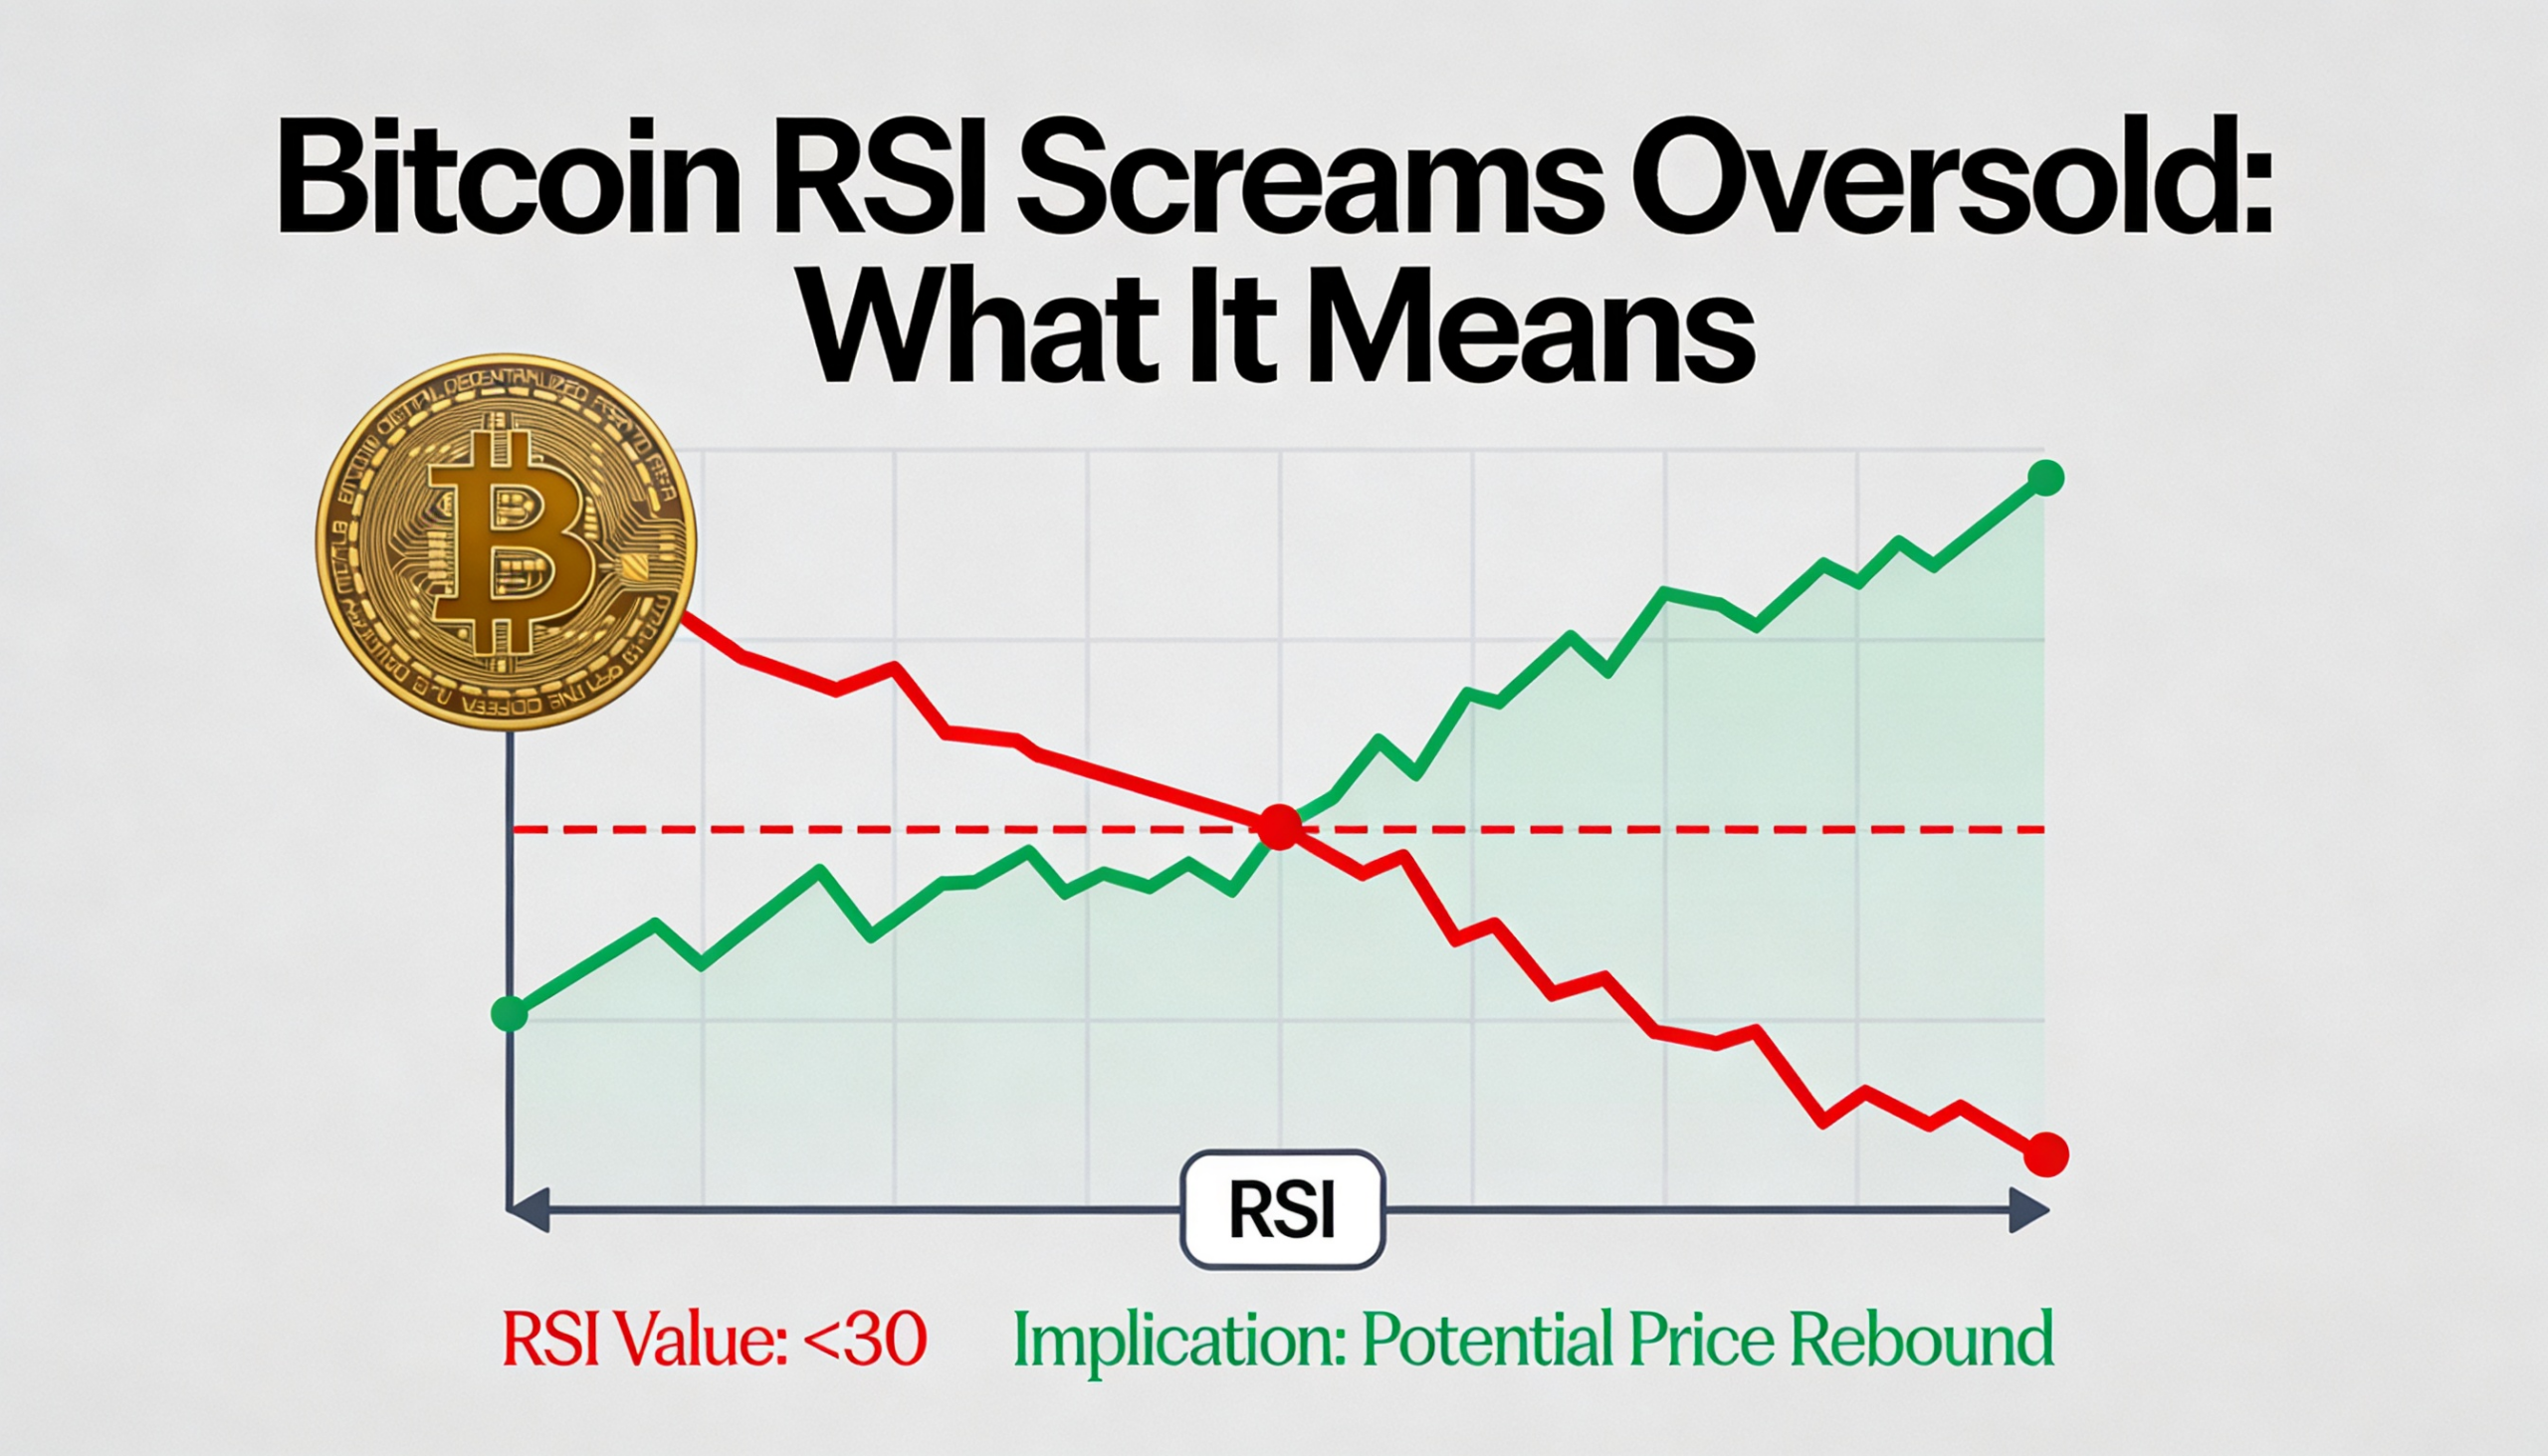
Bitcoin’s relative strength index has slipped below the 30 threshold, a level commonly associated with oversold conditions, as the cryptocurrency trades near a closely watched support band between $73,000 and $75,000.
The RSI is a widely followed technical indicator used to assess momentum and identify potential extremes in price action. It was developed in 1978 by mechanical engineer and technical analyst J. Welles Wilder Jr. and introduced in his book New Concepts in Technical Trading Systems.
Calculated over a standard 14-day period, the indicator compares recent price gains with losses and generates a reading that ranges from zero to 100. A reading below 30 indicates that losses have significantly outweighed gains over the recent period, signaling strong bearish momentum.
Such conditions are typically described as oversold, suggesting prices may have fallen too far, too fast relative to recent norms. Markets often see short-term rebounds following oversold readings, although the signal itself reflects past price action and does not guarantee a reversal.
In practice, oversold bounces can become self-reinforcing. Because many discretionary traders and algorithmic strategies track the RSI, buying interest often emerges at extreme readings, increasing the likelihood of a relief rally.
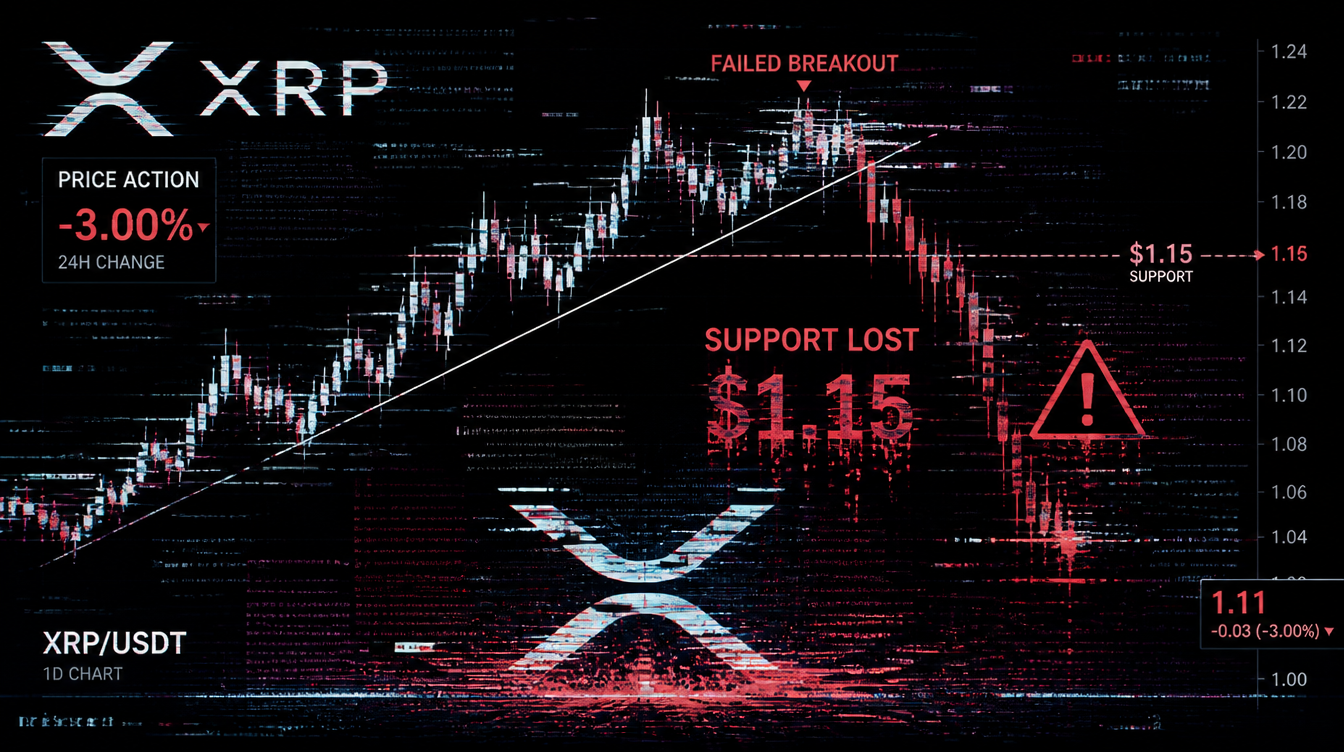
The signal tends to carry more weight when it aligns with established support. Bitcoin is currently hovering near the $73,000–$75,000 zone, an area that has repeatedly shaped price action. A sell-off in April 2025 stalled within this range, while the early-2024 rally also lost momentum at similar levels, underscoring the zone’s technical significance.
Together, the oversold RSI and nearby support suggest conditions may be forming for a bounce. Still, any rebound would not necessarily signal the start of a new bull phase.
Like other technical indicators, the RSI can generate false signals, particularly during broader downtrends. In 2022, oversold readings led to only modest recoveries, and more recently, a similar signal in November preceded a period of consolidation before prices resumed their decline last month.
For now, the indicator highlights stretched selling pressure, with the broader market context likely to determine whether a bounce can be sustained.