XRP Sets New Record, Market Echoes 2017 Rally Amid Broader Crypto Surge
XRP surged past $3.50 early Friday, marking new all-time highs as market momentum continues to build around the payments-focused asset. The explosive move has drawn comparisons to the 2017 bull run — not in exact form, but in unmistakable rhythm.
The token broke out from a multi-year symmetrical triangle last November, a technical setup that had compressed price action since 2018. Since then, XRP has gained over 580%, echoing its parabolic rise in 2017 when it jumped from $0.00056 to over $3.30 within 10 months.
“This isn’t history repeating, but it’s certainly rhyming,” market observers said, nodding to Mark Twain’s famous quote.
Back then, the rally was triggered by a breakout from a similar long-term triangle. Now, a nearly identical pattern appears to be playing out, with XRP already pushing beyond prior resistance zones.
Cooling Signs Suggest a Pause Is Likely
Despite the rally, XRP’s Bollinger Bands — volatility bands set two standard deviations from the 20-day moving average — have widened to their largest range since December, a classic precursor to sideways price action or consolidation.
Short-term indicators like MACD and RSI are also softening. The RSI has declined from overbought territory, while the MACD histogram shows weakening bullish momentum on lower time frames.
🔍 Short-Term View: A period of sideways movement between $2.90–$3.50 appears likely before the next breakout attempt.
- Key Resistance: $3.50 (ATH)
- Support Levels: $3.40, $3.00, $2.90
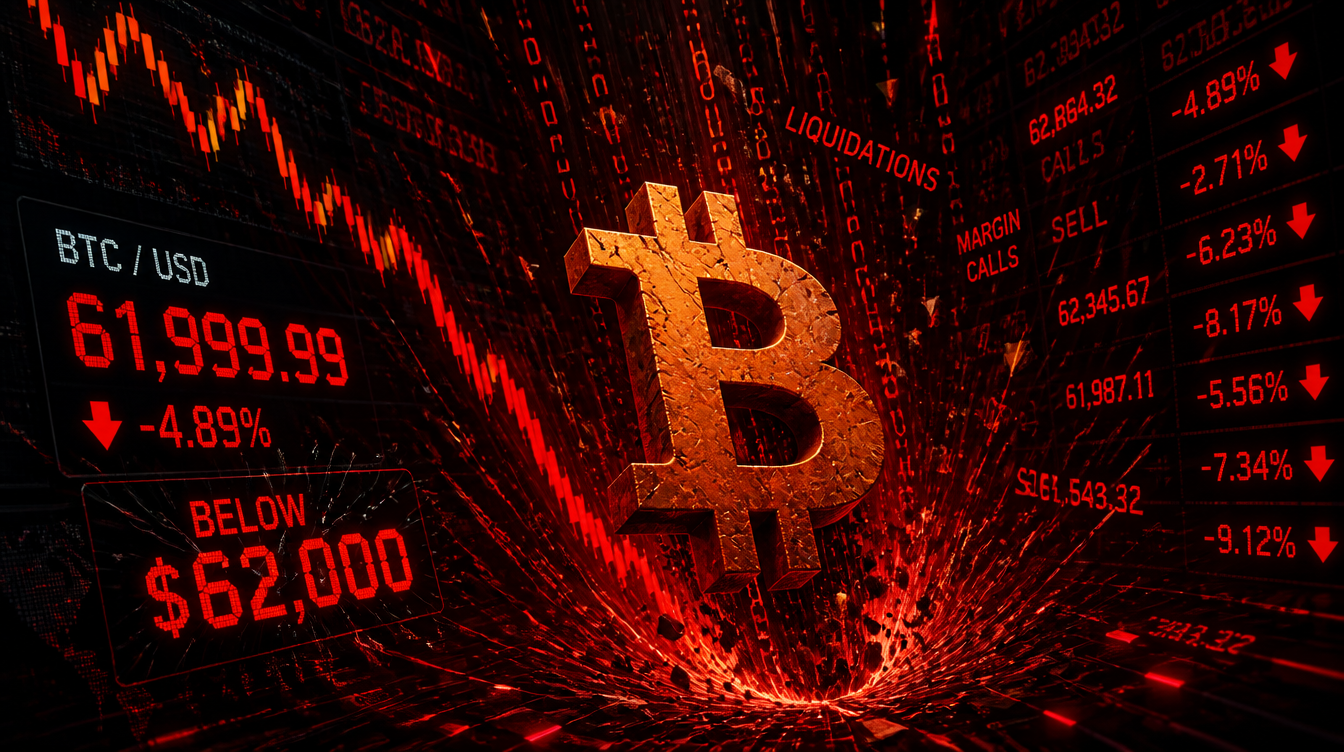
Bitcoin Hits Resistance at $120K, Signals Cooling Momentum
Bitcoin (BTC) has repeatedly failed to sustain momentum above $120,000 this week, with multiple daily candles showing upper wicks — an indication of buyer fatigue at higher levels.
The 50- and 100-hour simple moving averages have converged, reflecting indecision, while the 14-day RSI is rolling over from overbought levels. A retest of previous breakout levels, such as the May high near $111,965, remains on the table.
💡 AI Summary: BTC may require fresh catalysts or consolidation before a meaningful push toward $130K–$140K.
- Resistance Levels: $123,181, $130,000, $140,000
- Support Levels: $117,500, $115,740, $111,965
Ethereum Eyes $4,000 as Golden Cross Signals Outperformance
Ethereum (ETH) continues to show signs of leadership against Bitcoin, despite some short-term RSI divergence. A potential golden cross — where the 50-day moving average crosses above the 200-day — in the ETH/BTC ratio suggests Ether could outperform BTC in the coming weeks.
Price action on hourly charts remains constructive, and any pullbacks are likely to be short-lived, with strong dip-buying support evident across major exchanges.
🧠 AI Insight: ETH remains structurally bullish, with dips likely offering renewed entry points.
- Resistance Levels: $4,000, $4,100, $4,300
- Support Levels: $3,420, $3,083, $3,000
Solana Faces Resistance at $187, but Momentum Builds
Solana (SOL) has paused near the $185–$187 zone — the same level it topped in May. However, the broader setup remains bullish: the Guppy multiple moving average indicator has turned green, and SOL continues to trade above the Ichimoku Cloud, both of which support further upside.
The Bollinger Band width is expanding again, suggesting a volatility spike could be imminent. Still, a break below the hourly cloud would increase downside risk.
⚠️ AI Note: Expect increased volatility. SOL looks primed for a break toward $200 unless short-term support breaks.
- Resistance Levels: $187, $200, $218
- Support Levels: $168, $157, $145