


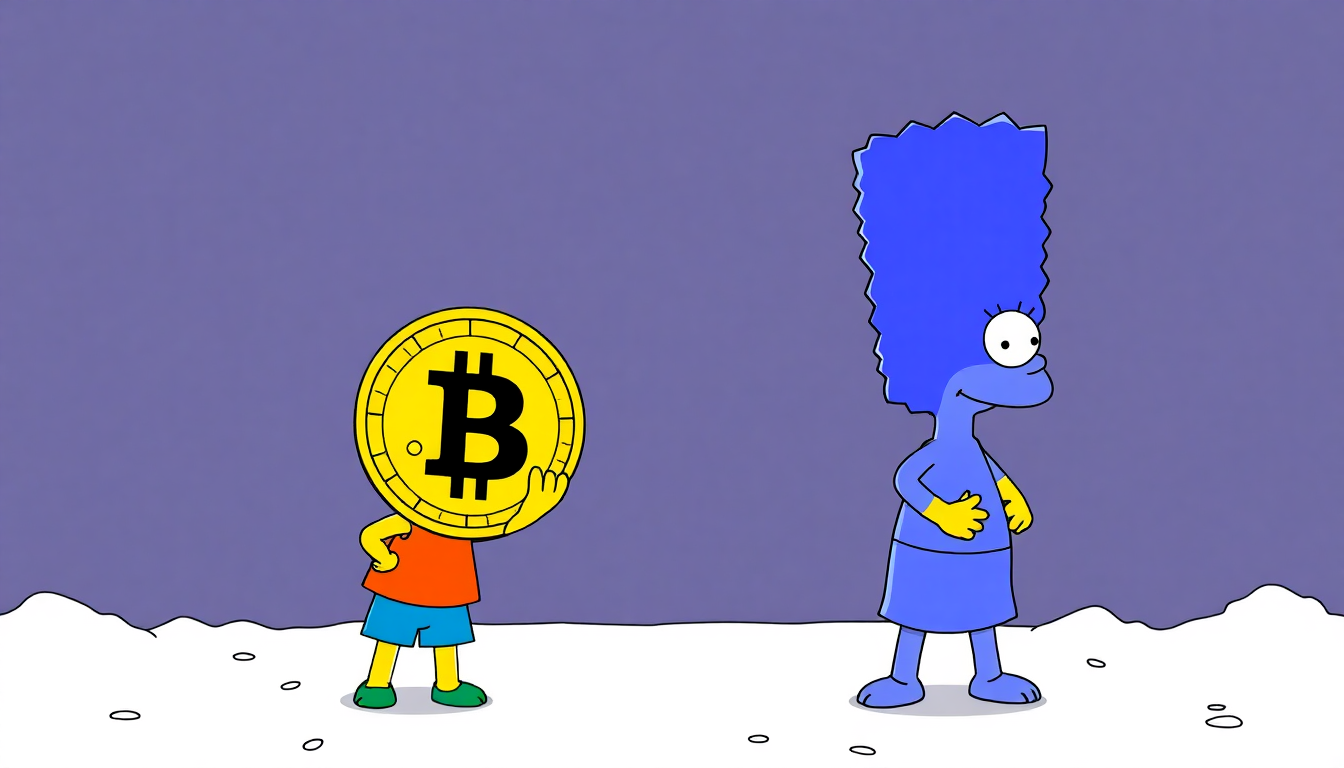
The crypto market is once again drawing comparisons to a cartoon character as bitcoin and other major tokens retreat from their recent highs.
The term “Bart Simpson” has resurfaced among crypto traders, referring to the spiky-haired character from The Simpsons. The nickname describes a chart pattern in which prices surge sharply, move sideways for a period and then reverse lower, creating a shape similar to Bart’s hairstyle.
Bitcoin, XRP and ether are among the cryptocurrencies experiencing the pullback. The bitcoin version of the pattern was originally coined in 2015 by former X user @whaleclubco, when BTC was priced at $229. It had largely disappeared from crypto market discussions for at least three years before traders began spotting it again on Sept. 1.
The potential formation quickly generated discussion on crypto X. Ben Cowen, founder of Into the Cryptoverse and a market analyst, told his 1.2 million followers that bitcoin appeared to be developing the setup.
A typical Bart Simpson pattern unfolds in three distinct steps. The first is the Spike, representing a rapid and powerful price move that can prompt traders to chase the momentum. The market then enters the Flat Range, known as the “head,” where prices consolidate within a relatively narrow area and trading activity generally weakens. The final stage is the Snap Back, when prices abruptly reverse the original move. When all three stages appear together, the resulting chart can resemble Bart Simpson.
Bitcoin’s move began with the Spike on Aug. 19, when BTC was trading around $64,420. Two days later, bitcoin had gained almost $14,000, reaching approximately $78,300. The rally continued until BTC encountered resistance just below $80,700 on Aug. 25. Bitcoin was trading around $76,500 at the time of writing, based on CoinDesk data.
The recent sequence of moves has created a chart that bears a striking resemblance to the cartoon-inspired setup, with bitcoin now potentially entering the Snap Back phase.
Market participants remain split over what happens next. Some traders argue that bitcoin’s broader bullish trend remains intact and expect the cryptocurrency to resume its advance. Others believe a deeper retracement could create an attractive entry point before another leg higher.
Mati Greenspan, founder of Quantum Economics and a former senior analyst at eToro, said the decline would need to reach at least 20% for the formation to qualify as a true Bart Simpson pattern. He nevertheless said he considers such a move unlikely.
Greenspan said the pattern was once a recognizable feature of bitcoin’s less mature market structure, when liquidity and market depth were considerably lower.
He added that he could not recall seeing a clean example in several years. While such formations remain possible, the growth of liquidity, market depth and institutional involvement appears to have reduced their frequency in bitcoin’s price action.
Greenspan also pointed out that the setup is not limited to bitcoin, although he sees XRP as a more convincing example.
XRP’s near-vertical rally from around $1 to $1.70 has created the necessary conditions for the formation. Greenspan said a sharp retracement toward the level where that rally started would make the pattern particularly clear.
In XRP’s case, the Spike began at the same time as bitcoin’s move on Aug. 19. XRP climbed from roughly $1 to $1.52 by Aug. 22 before entering a Flat Range. The token has remained within that phase while gradually moving lower, trading near $1.32 at the time of writing.
Frank Hepworth, CEO and founder of New Market Trading, considers the current chart structure a more serious warning. He described the Bart Simpson formation as a traditional distribution pattern in which larger investors sell their positions while retail traders continue buying.
According to Hepworth, bitcoin’s “Bart’s hair” emerged as BTC repeatedly failed to break through its 50-week moving average around $81,000. He views that level as the “last line in the sand” for bears.
The repeated rejection leaves bitcoin exposed to a move toward $70,000, Hepworth said, while stronger selling could push the cryptocurrency as low as $58,000. In response to those risks, his firm has reduced its exposure.
XRP faces an additional problem because its performance relative to bitcoin has weakened, Hepworth said.
The XRP/BTC trading pair has slipped below its 20-week moving average, suggesting XRP could lose further ground against bitcoin if the broader market turns lower. Under a scenario where BTC declines toward $70,000, Hepworth estimates XRP could fall somewhere between $0.55 and $1.21.
A deeper bitcoin decline to $58,000 could leave XRP as low as $0.46, according to Hepworth.