

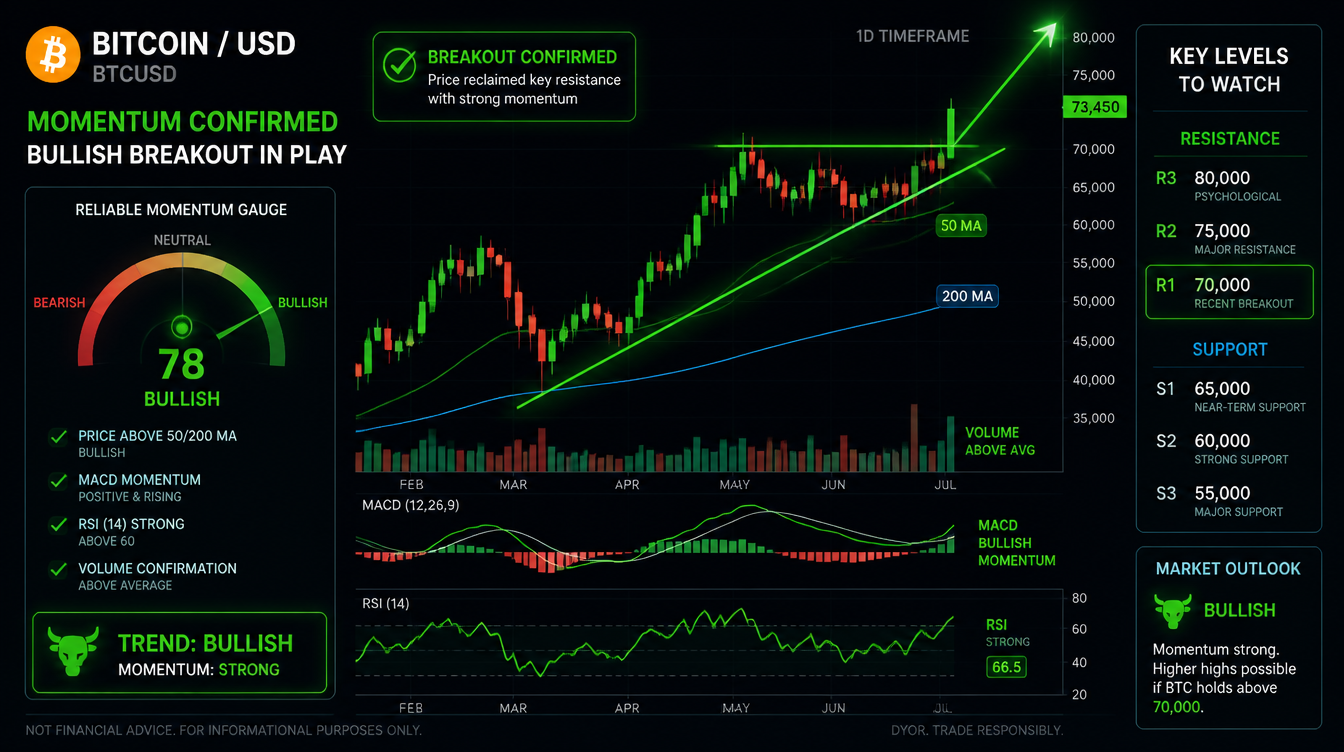
Bitcoin’s long-term MACD indicator has turned bullish, suggesting stronger momentum ahead, but the cryptocurrency still needs to overcome several key resistance levels before confirming a broader uptrend.
Bitcoin has gained almost 10% during the month and could extend its recovery toward the $70,000 region, a price area that has repeatedly acted as a ceiling in recent months.
The bullish signal comes from the moving average convergence divergence (MACD) histogram, a popular technical indicator used to measure the direction and strength of market momentum. When the histogram moves above the zero line, it typically indicates improving bullish momentum, while a move below zero points to weakening market conditions.
The standard MACD calculation uses 12-day and 26-day moving averages along with a 9-day signal line. However, these shorter time frames can often create false moves and frequent reversals. To remove some of that market noise, many traders rely on longer-term settings, including the 50-day, 100-day, and 9-day parameters.
The longer-term MACD histogram has now crossed into positive territory, signaling that bitcoin’s broader momentum is shifting upward. This suggests the recent recovery could continue rather than quickly fading. At the time of writing, bitcoin was trading above $64,000.
While experienced traders usually combine multiple indicators before making decisions, this version of the MACD has historically provided useful signals during major bitcoin price cycles. Since BTC dropped from its record high near $126,000, bearish MACD signals have often appeared ahead of stronger declines, while bullish crossovers have coincided with meaningful recovery periods, including the December–January and February–May rebounds.
The latest positive crossover indicates that bitcoin may have room for further upside, but it does not necessarily confirm the beginning of a full-scale bull market. Additional technical confirmation is needed, making the following resistance levels important for traders.
Major Bitcoin Levels in Focus
50-day moving average: Approximately $65,434
Bitcoin’s first challenge is the 50-day simple moving average, which tracks the average price over the previous 50 trading days. This indicator is widely followed as a measure of short-term market strength. A sustained move above this level could signal that buyers are gaining control.
$67,292 resistance level
The next major barrier sits at $67,292, which marked bitcoin’s mid-June high. BTC bounced from lows near $60,000 earlier in June before facing strong selling pressure around this area. A breakout above $67,292 would show that buyers have successfully cleared a significant resistance zone.
200-day moving average: Around $71,147
The biggest hurdle remains the 200-day moving average, a key indicator used to identify long-term market trends. This level previously blocked bitcoin’s recovery in early May after the rally from February lows near $60,000. A convincing break above this area would strengthen the case for a sustained bullish trend.
Until bitcoin moves above these resistance zones, bulls may need to maintain a cautious approach despite the improving momentum.
$80,000 Options Level Could Trigger Volatility
Traders are also keeping an eye on the $80,000 strike price in Deribit’s bitcoin options market. The level carries more than $1.21 billion in open interest, making it the largest options concentration on the exchange.
If bitcoin approaches the $80,000 mark, traders adjusting or hedging their positions could increase activity across spot and futures markets, potentially leading to larger price swings.