Bitcoin holdings attributed to so-called “conviction buyers” have expanded to nearly 4 million BTC, representing a roughly 300% increase since late 2025 and pointing to a deepening structural shift in the market.
Citing BitGo data, Bitfinex reported that a growing portion of bitcoin supply is being consolidated by long-term holders—entities that exhibit limited spending behavior and strong accumulation patterns. The trend reflects a significant reallocation of realized value into investors with longer time horizons.
At current prices near $80,000, these conviction-driven holdings are valued at more than $320 billion.
“Even if the exact construction of BitGo’s ‘conviction buyers’ metric isn’t fully transparent, the broader implication is clear,” said Mati Greenspan, founder of Quantum Economics. “Historically, when liquid supply tightens alongside renewed demand, it creates the foundation for outsized price expansions.”
According to Bitfinex, the latest surge marks the largest two-quarter increase in high-conviction accumulation since the aftermath of the 2020 COVID-19 market downturn. This cohort includes both institutional allocators and long-term individual investors.
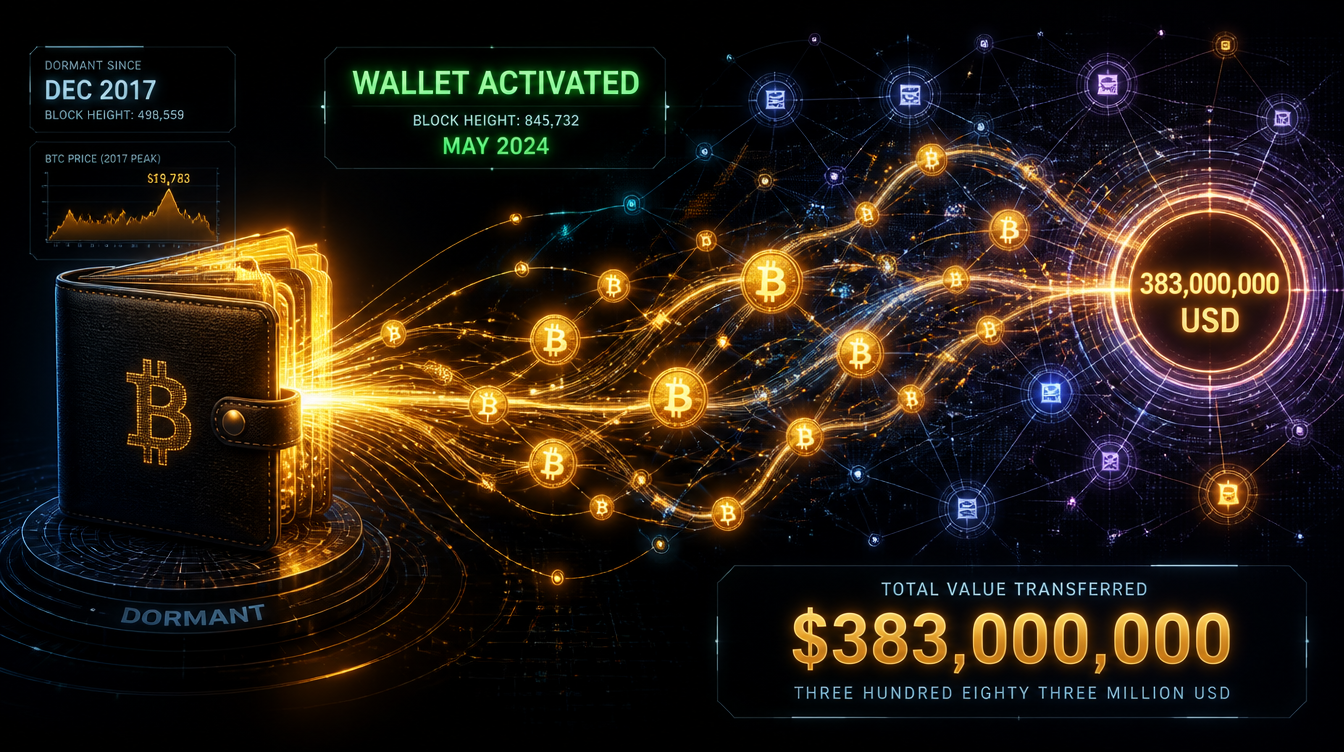
These holdings are separate from the estimated 5.6 million BTC that has remained dormant for over a decade, as noted by developer Jameson Lopp. With total circulating supply at approximately 20.03 million BTC, an increasing share is effectively being removed from active market participation.
Bitfinex analysts further observed that a rising proportion of bitcoin’s realized value is migrating off exchanges into wallets associated with low-activity entities, reducing the pool of readily tradable supply.
This dynamic is being reinforced by sustained institutional demand and corporate treasury adoption. Strategy (MSTR), the largest publicly traded corporate holder of bitcoin, recently increased its holdings to 818,869 BTC—acquired for nearly $62 billion—and is currently sitting on roughly $4.6 billion in unrealized gains.
As more bitcoin becomes concentrated in these low-turnover hands, available market liquidity continues to contract, raising the potential for a supply shock should demand accelerate.
Additional data from CEX.IO supports the notion of a strengthening market base, showing that nearly 70% of recently acquired bitcoin is now in profit. This tends to act as a stabilizing force, as investors sitting on gains are generally less inclined to sell into short-term weakness.
CEX.IO analysts noted that as more market participants move into profitable territory, the likelihood of reactive selling diminishes, contributing to smoother price action.
“Investors who understand bitcoin’s long-term value proposition are typically focused on accumulation rather than distribution—especially with the growing ability to borrow against BTC holdings,” said Ran Hammer, vice president of business development at Orbs. “That structurally reduces the amount of supply available to the market.”
Connor Howe, CEO and co-founder of Enso, added that bitcoin’s scarcity narrative is increasingly manifesting in observable market behavior.
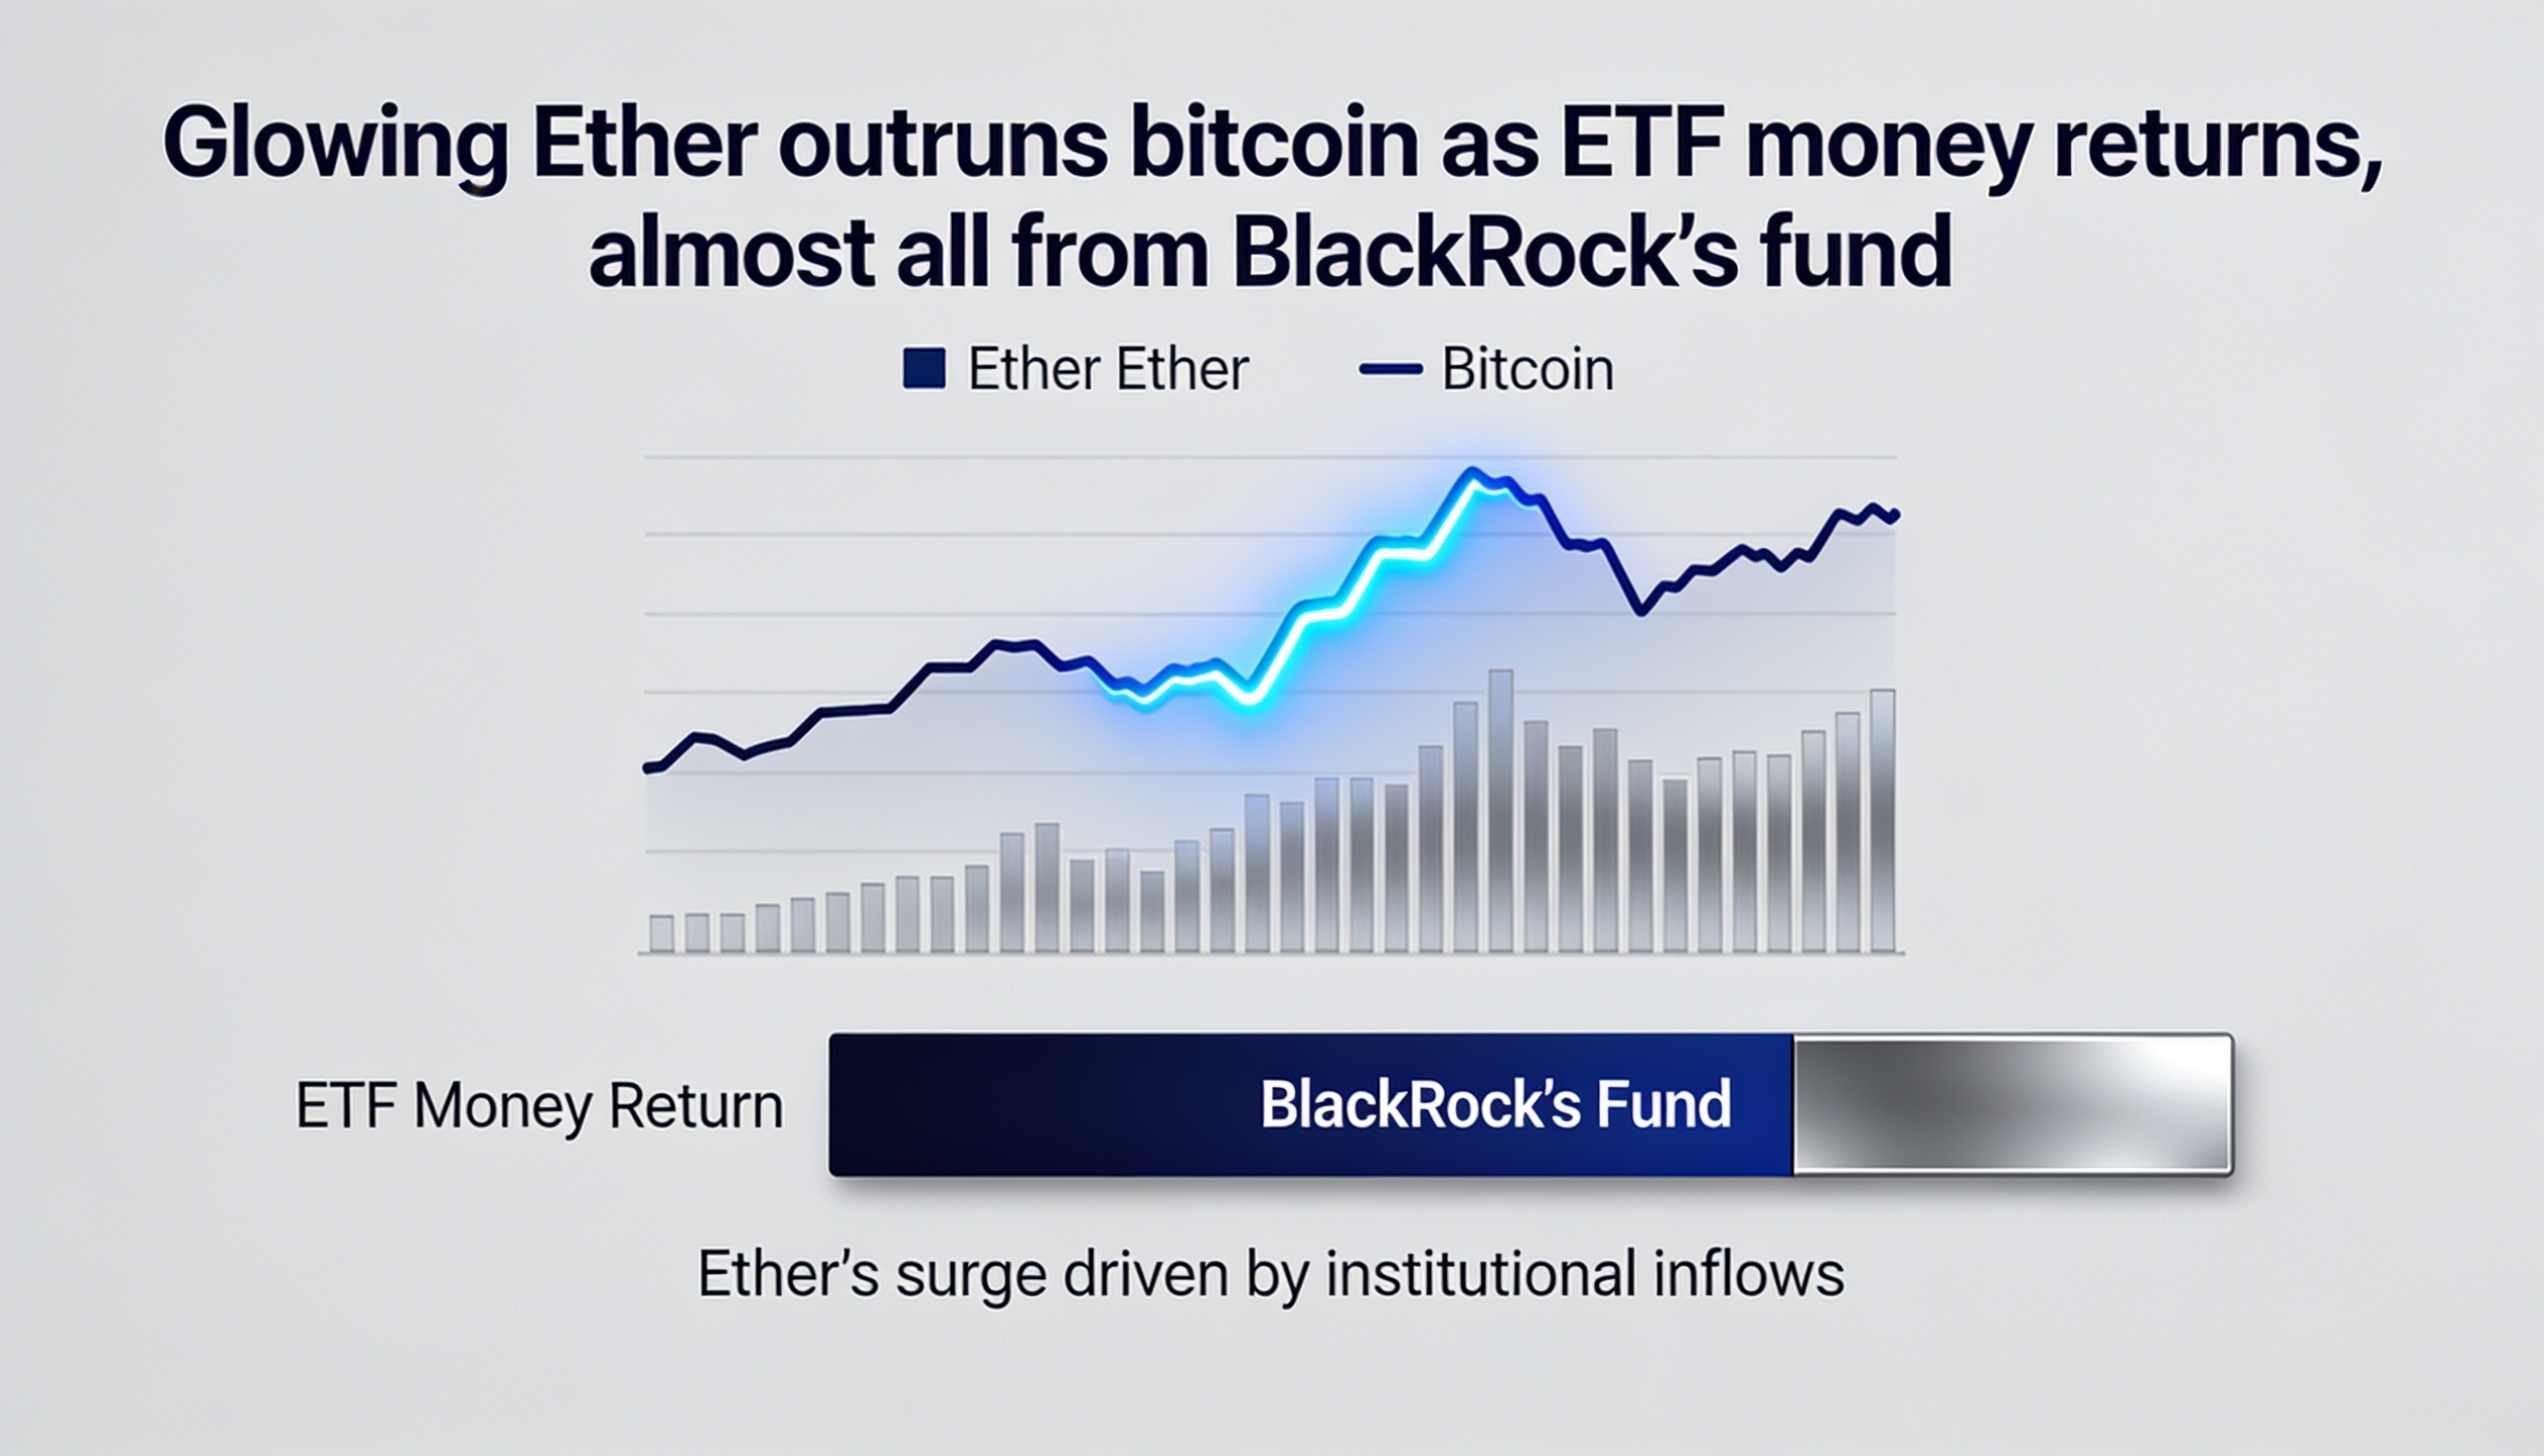
“With ETF inflows and institutional participation becoming structural, not speculative, a larger portion of supply is moving into conviction hands,” Howe said. “That could make future supply constraints far more pronounced as demand scales.”