

XRP’s Price Struggles Despite SEC Case Closure, Bearish Signals Emerge
XRP’s price action remains lackluster following the U.S. Securities and Exchange Commission’s (SEC) decision to drop its case against Ripple. Despite initial optimism, technical indicators now suggest a potential shift toward a bearish trend.
Last week, an XRP enthusiast on X expressed frustration, exclaiming, “You’re not bullish enough!” as the crypto community celebrated the long-awaited resolution of Ripple’s legal battle. The lawsuit had been a significant overhang on XRP’s price performance during the 2021 bull market. Hopes for an XRP ETF and speculation about its inclusion in the U.S. strategic reserve added to the excitement.
However, XRP has failed to sustain upward momentum, trading in a tight range between $2.30 and $2.50. This stagnation is concerning, especially as key technical indicators hint at a possible downtrend.
Lack of Follow-Through After Initial Surge
XRP initially jumped 11% to $2.59 last Wednesday on the SEC news. Yet, instead of continuing its upward trajectory, the token has struggled to maintain bullish momentum. This comes despite broader market optimism, including speculation that expected trade tariffs from former President Donald Trump on April 2 may be less severe than previously anticipated.
Technical Indicators Flash Bearish Warnings
Three-Line Break Chart Signals Trend Reversal
A key trend-following indicator, the three-line break chart, suggests a bearish shift. This chart filters out short-term noise, focusing solely on price movements to identify significant trend changes.
In this system, a new red bar emerging below the lowest point of the last three green bars signals bearish momentum. XRP’s weekly chart recently printed a red bar, which has remained intact even after the SEC announcement. Similar patterns marked the onset of prolonged bear markets in 2018 and 2021.
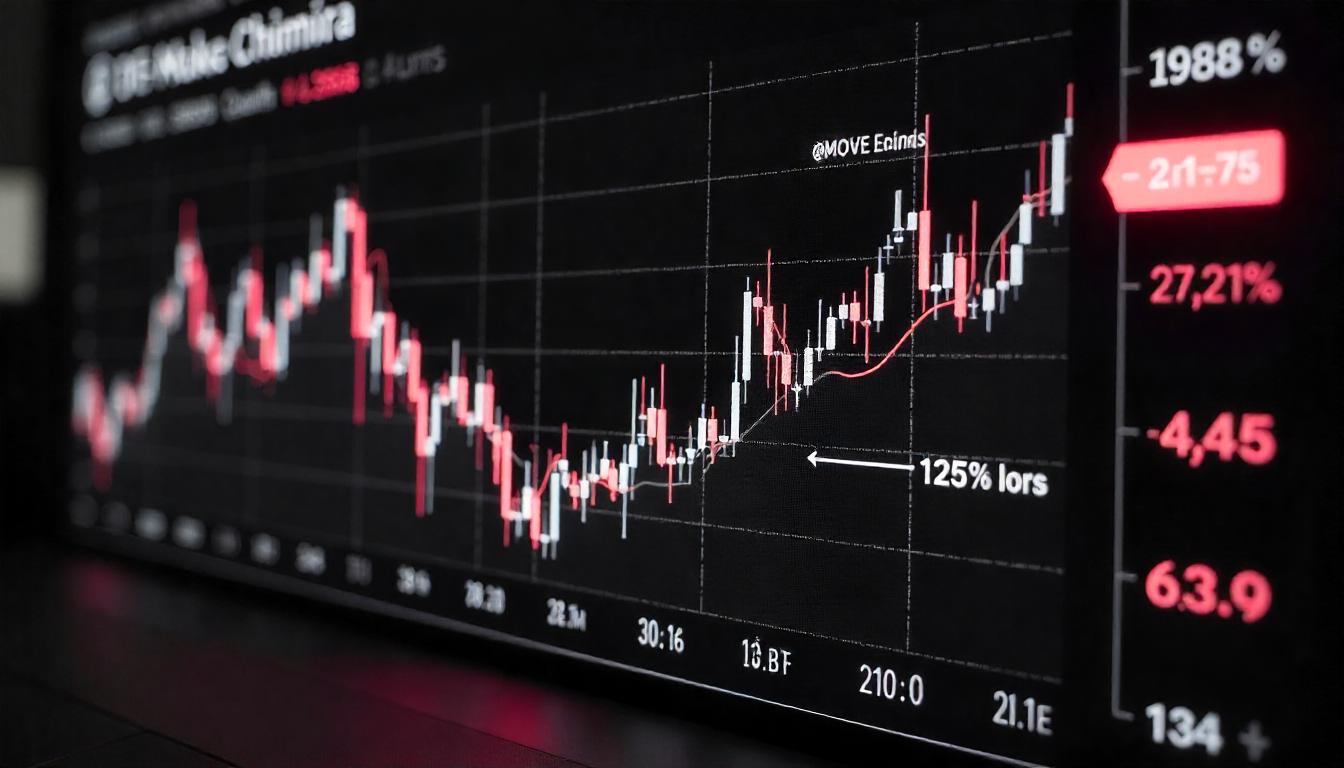
MACD and Moving Averages Support Bearish Outlook
The moving average convergence divergence (MACD) histogram, which measures trend strength, is showing deepening negative bars below the zero line—another sign of growing downside pressure.
Notably, the MACD turned positive in November, fueling XRP’s rise from $1 to over $3. However, momentum appears to be fading, with the 5-week and 10-week simple moving averages (SMAs) crossing bearishly, suggesting that the path of least resistance is downward.
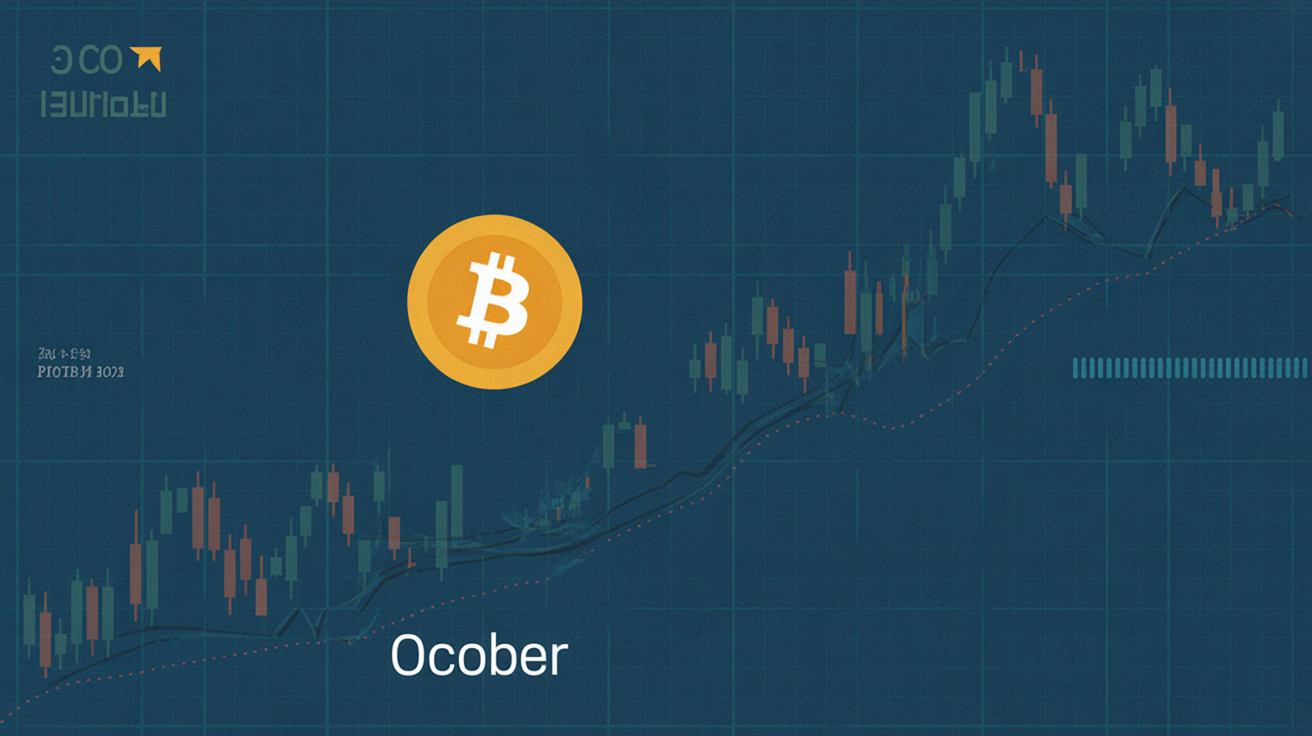
Bollinger Bands Indicate Potential Pullback
XRP’s Bollinger Bands—volatility bands positioned two standard deviations above and below the 20-week SMA—have widened significantly due to the token’s sharp rally in late 2024 and early 2025. Historically, such expansions have preceded price declines, as seen in mid-2021 and early 2018.
What Could Turn XRP Bullish Again?
For XRP to regain its bullish momentum, a decisive break above the $3 level, last reached on March 2, would be necessary. Such a move would invalidate the bearish lower highs pattern and reinstate a more optimistic technical outlook.
While some analysts predict XRP could reach $10 by the end of the decade, the short-term outlook remains uncertain as the token struggles to build on the SEC news.


Leave a Reply