Bitcoin Shows Signs of Rebound as Seller Exhaustion Appears at 200-Day SMA
A key technical support level suggests BTC may be gearing up for a price recovery.
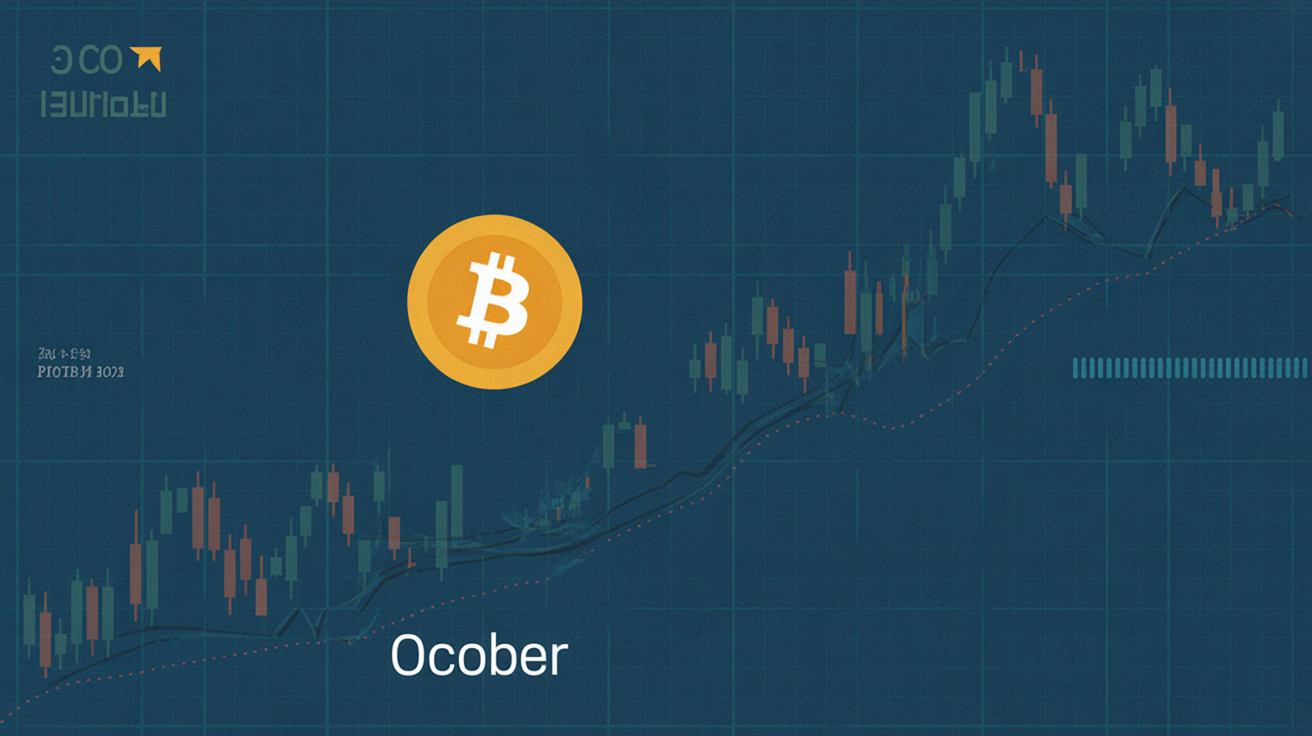
Market psychology often reveals itself through candlestick patterns, offering insights into trader sentiment. Since Friday, at least two Bitcoin (BTC) candlesticks have hinted at underlying bullish momentum near multi-month lows, potentially signaling a shift in market dynamics.
The chart below highlights how BTC’s price decline has found support at the 200-day simple moving average (SMA) since last Wednesday. Notably, Tuesday and Friday’s daily candles both feature small bodies with long lower wicks—an indication that sellers attempted to push BTC below the SMA but struggled to maintain control, likely due to strong buying interest at that level.
This pattern suggests weakening bearish pressure, which traders often interpret as a precursor to a potential trend reversal. When such candles appear following a sustained downtrend, they can serve as early signals of a market rebound.
If this bullish setup holds, BTC could make a move back toward Sunday’s high of approximately $95,000. A breakout beyond that level might reignite bullish momentum, potentially setting the stage for a run toward the psychological $100,000 mark. However, if BTC fails to hold the 200-day SMA, further downside could be in play.