Bitcoin’s ongoing price range between $90,000 and $110,000 may resolve with a bullish outcome, according to historical trends linked to the 200-week simple moving average (SMA). Despite concerns over rising inflation in the U.S. potentially challenging the current upward trend, past data suggests there is still significant upside potential for Bitcoin (BTC).
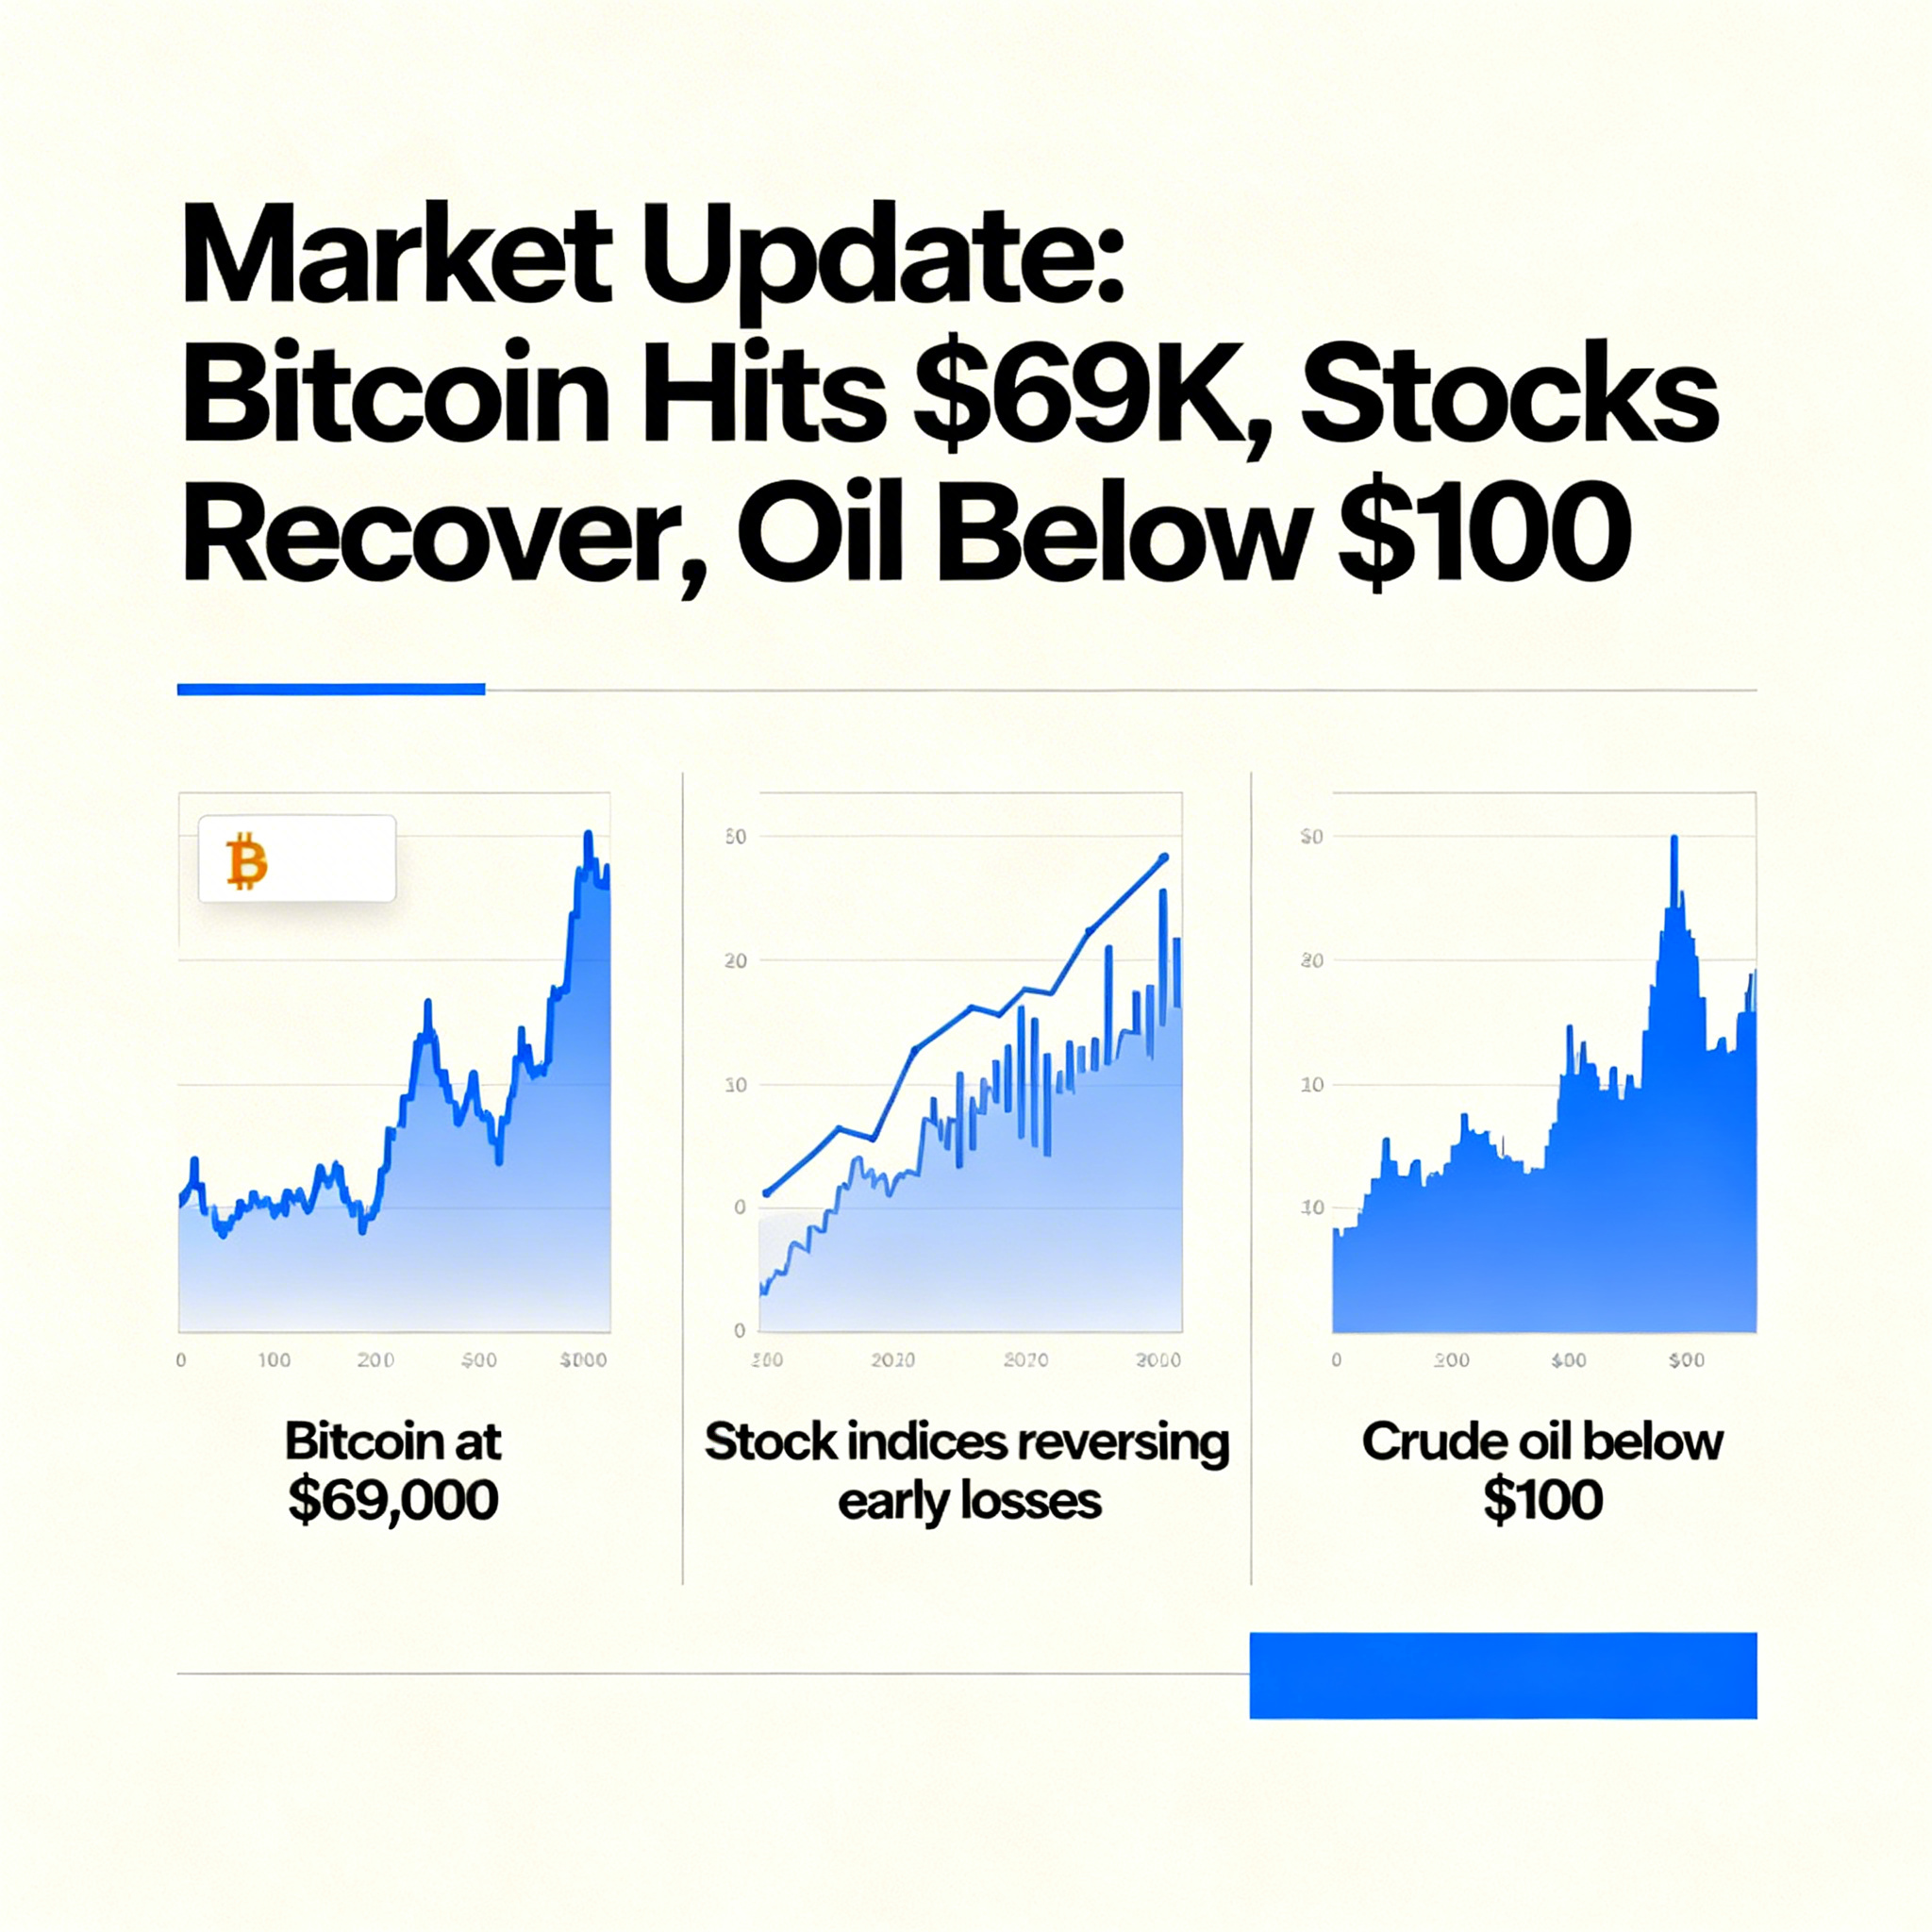
As of the latest data, Bitcoin’s 200-week SMA stood at $44,200, as per TradingView, which is the highest it has ever been. However, it still remains considerably lower than the peak of the previous bull market, which hit $69,000 in November 2021.
This discrepancy is noteworthy because previous market cycles show that bull markets tend to end when the 200-week SMA aligns with the record highs of the preceding bull run. For instance, in late 2021, the 200-week SMA rose to $19,000, in line with the peak of the 2017 bull market. Similarly, the 2017 bull market ended when the 200-week SMA rose to over $1,200, which had been the record price four years earlier.
If this historical pattern continues, Bitcoin’s current price consolidation within the $90,000 to $110,000 range is likely to break out bullishly, setting the stage for the next significant price increase.
Options data from Deribit also supports the bullish forecast indicated by the 200-week SMA. According to Amberdata, options with expiration dates of three months or longer show higher premiums for call options compared to put options, suggesting that the market expects Bitcoin prices to rise.
In addition, most of the open interest is concentrated in call options with strike prices higher than Bitcoin’s current market price of $96,700. Notably, the most popular call option is the $120,000 strike, which has a notional open interest exceeding $1.8 billion, further reflecting bullish market sentiment. Open interest refers to the total number of active or open contracts in the market.