Crypto Market Snapshot: Bitcoin Faces Consolidation at $120K as Ethereum, XRP, and Solana Signal Cooling Momentum
Bitcoin: Consolidation at $120K Hints at Potential Pullback
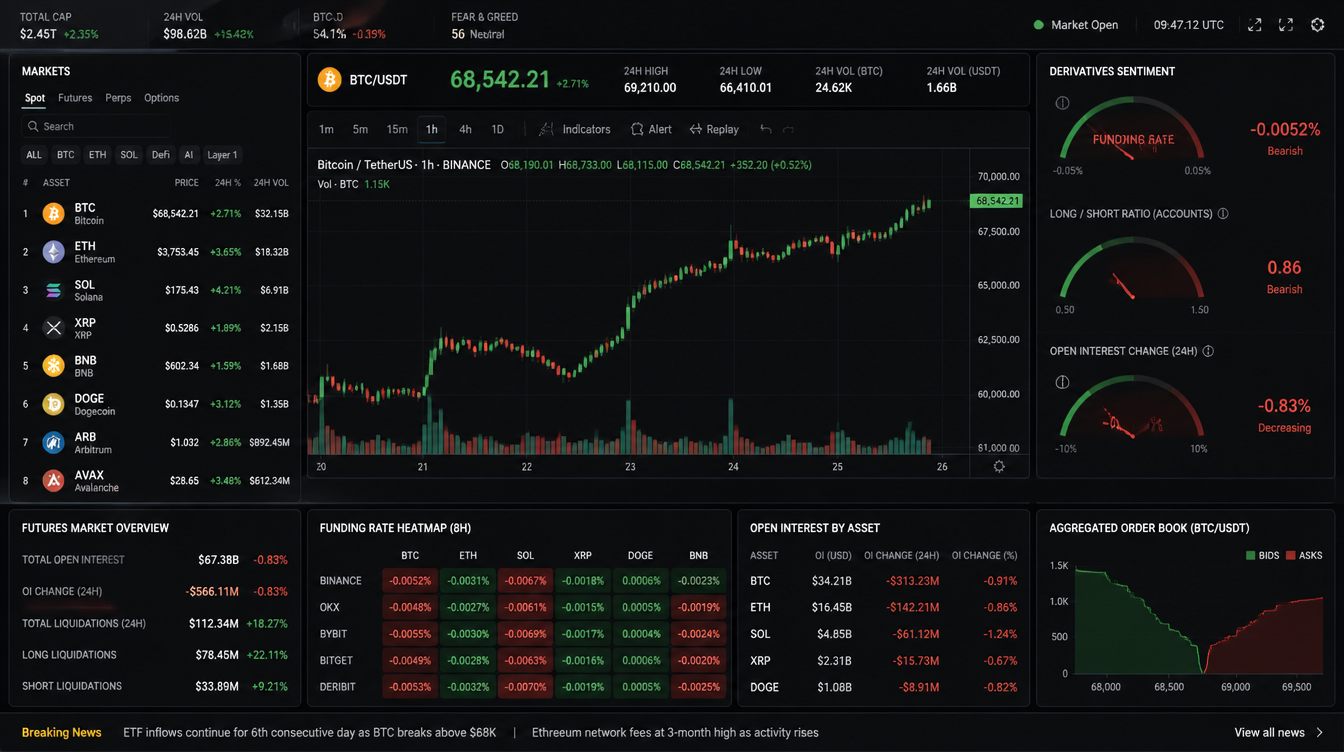
Bitcoin (BTC) is locked in a narrow trading range just below $120,000, with options market dynamics suggesting a consolidation phase. Deribit data shows a significant concentration of positive dealer gamma at the $120,000 and $120,500 strikes, which often leads market makers to stabilize prices by buying low and selling high—thereby muting volatility.
Technically, BTC faces key support in the $116,000–$117,000 region. A breakdown below this zone could pave the way for a revisit of May’s peak near $112,000. On the flip side, a decisive breakout above $120,000 could fuel a new push toward record highs.
A warning signal emerged on July 22 from a three-line break chart, which printed a very narrow 0.12% green bar—typically a sign that buying strength is rapidly fading.
AI Take: The marginal green candle on the three-line break chart signals fading momentum in the uptrend. Despite ongoing bullish sentiment, the market appears to be losing steam.
- Resistance: $120,000, $123,181
- Support: $116,000–$117,000, $114,700, $111,965
Ethereum: Pulls Back After Hitting 7-Month High
Ethereum (ETH) briefly surged to $3,937—its highest level in seven months—before slipping back to $3,880, reflecting a loss of bullish momentum. The move higher negated a prior Doji pattern, but failed to trigger a follow-through rally.
Notably, the 14-day RSI did not confirm the higher price, hinting at bearish divergence. Additionally, the MACD histogram on the daily chart is nearing a bearish crossover. Fundamentally, Ethereum’s protocol revenues and fees have not kept pace with price gains, underscoring a disconnect.
AI Take: RSI divergence and weakening MACD suggest a potential trend reversal. Caution is warranted unless ETH reclaims $3,900 with conviction.
- Resistance: $4,000, $4,100, $4,382
- Support: $3,770, $3,510, $3,000
XRP: Slips From Resistance, Trend Reversal in Play
XRP has rolled over after failing to hold gains near the $3.35 zone—a former support level that has flipped into resistance. Momentum indicators are weakening, with the RSI breaking below a key uptrend line and the MACD histogram turning negative on the hourly chart.
A revisit of the July 24 low at $2.96 appears likely. If that level fails to hold, XRP could slide further toward the May high of $2.65. A tweezer top pattern on the weekly chart, with highs capped at $3.65, reinforces the bearish case.
AI Take: The weekly tweezer top pattern is a strong reversal signal. XRP appears to be transitioning into a corrective phase.
- Resistance: $3.35, $3.65, $4.00
- Support: $2.96, $2.65, $2.44 (200-day SMA)
Solana: Trend Intact but Bearish Pressure Persists
Solana (SOL) has bounced back above the hourly Ichimoku cloud and is forming higher lows, suggesting a near-term rebound is underway. A retest of $200—the upper boundary of its ascending channel—remains possible.
However, bearish risks persist due to a tweezer top pattern near $205–$206 on the daily chart. A drop below $184 would invalidate the bullish setup and expose the 200-day SMA near $163.
AI Take: Solana’s rebound is encouraging, but the bearish candle structure at recent highs cannot be ignored. A close below $184 would confirm a shift in trend.
- Resistance: $205–$206, $218, $252
- Support: $184, $163, $126