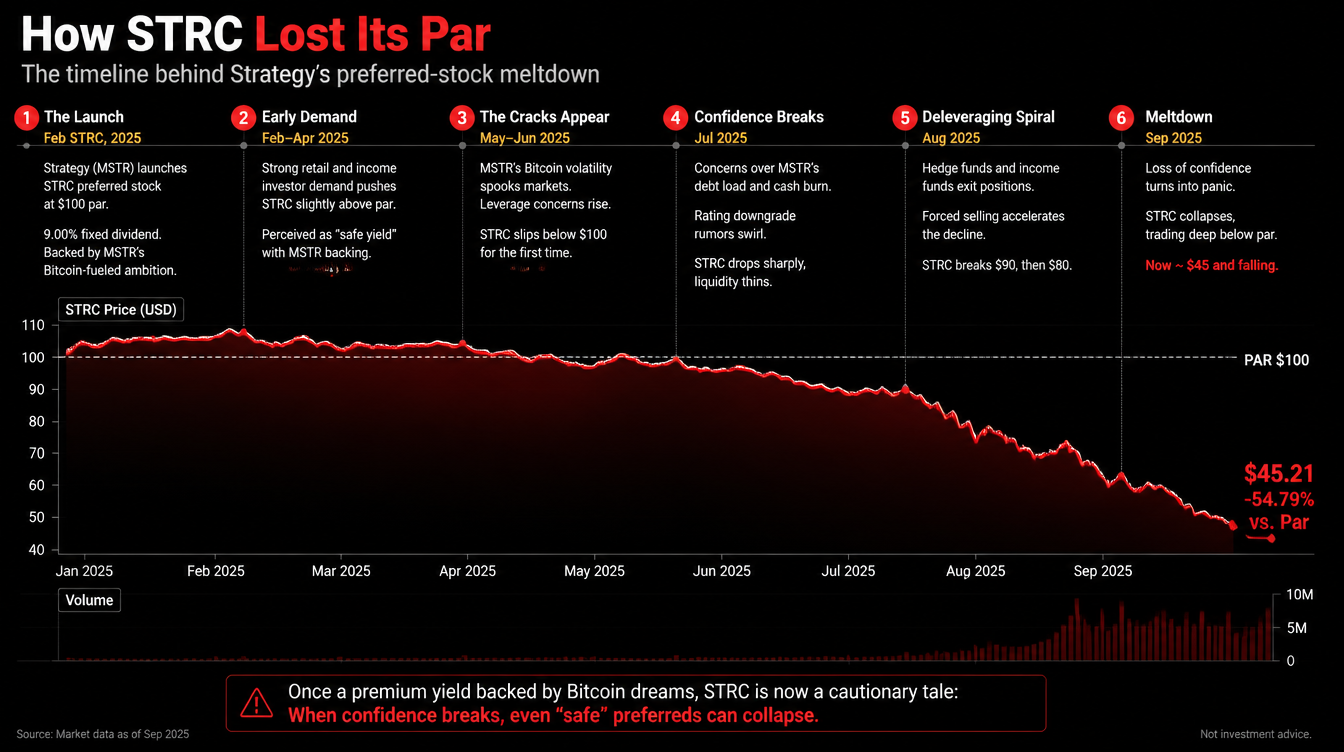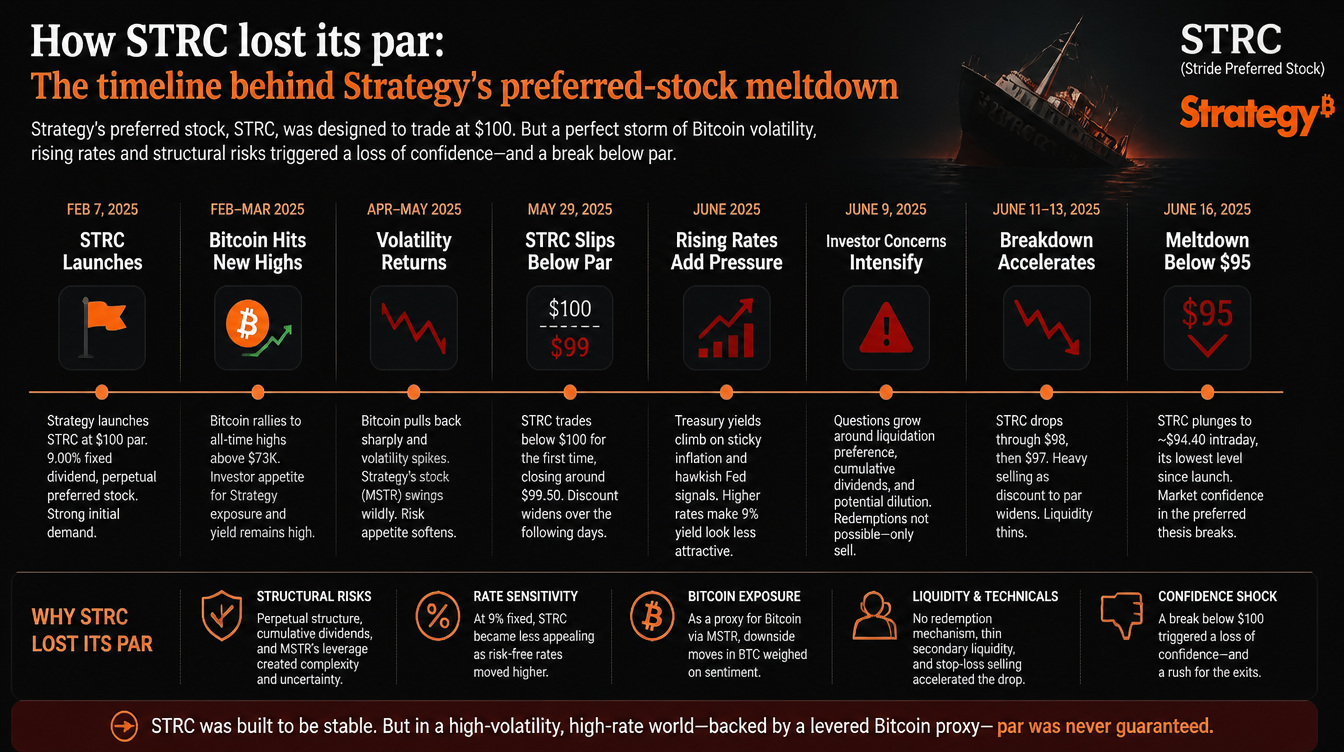
Bitcoin Faces Key Resistance Levels Above $88K — Will the Rally Continue?
Bitcoin’s bullish momentum has recently encountered a critical resistance zone above the $88,000 mark, with several key technical levels coming into play that could dictate whether the rally continues or takes a downturn.
At the heart of this resistance is the 200-day simple moving average (SMA), currently sitting at $88,356. The SMA is a widely-followed indicator of long-term market trends, and Bitcoin’s struggle with this level marks a crucial moment. Earlier this month, analysts at Coinbase Institutional pointed to Bitcoin’s breakdown below the 200-day SMA in March as a potential sign of a forthcoming “crypto winter.”
For Bitcoin to maintain its upward momentum, breaking through this level would be a strong signal that the bull market is back on track.
A move above the 200-day SMA would likely trigger a dual breakout. Not only would Bitcoin surpass the SMA, but it would also push through the upper boundary of the Ichimoku Cloud, a popular technical analysis tool that indicates shifting momentum. The Ichimoku Cloud is known for providing a comprehensive picture of market sentiment, outlining support and resistance levels, and identifying potential trend reversals.
The Ichimoku Cloud itself is made up of five components: Leading Span A, Leading Span B, the Conversion Line (Tenkan-Sen), the Base Line (Kijun-Sen), and a lagging closing price line. The space between Leading Span A and B forms the Cloud, which traders watch for breakouts or breakdowns as signals of future price movements.
Adding further weight to the resistance zone is the March 24 high of $88,804, where Bitcoin faced a sharp reversal that saw it retreat to the $75,000 range. This level remains a critical point of resistance as the market faces its next challenge.
Bitcoin’s price action over the coming days will likely be determined by whether it can break through this trifecta of resistance. If it does, it could signal a continuation of the bullish rally. However, failure to overcome these levels could signal a potential correction in the near term.