Bitcoin’s latest downturn has renewed concerns that prices could fall further, with long-term historical indicators pointing to the 200-week moving average as a critical level for investors.
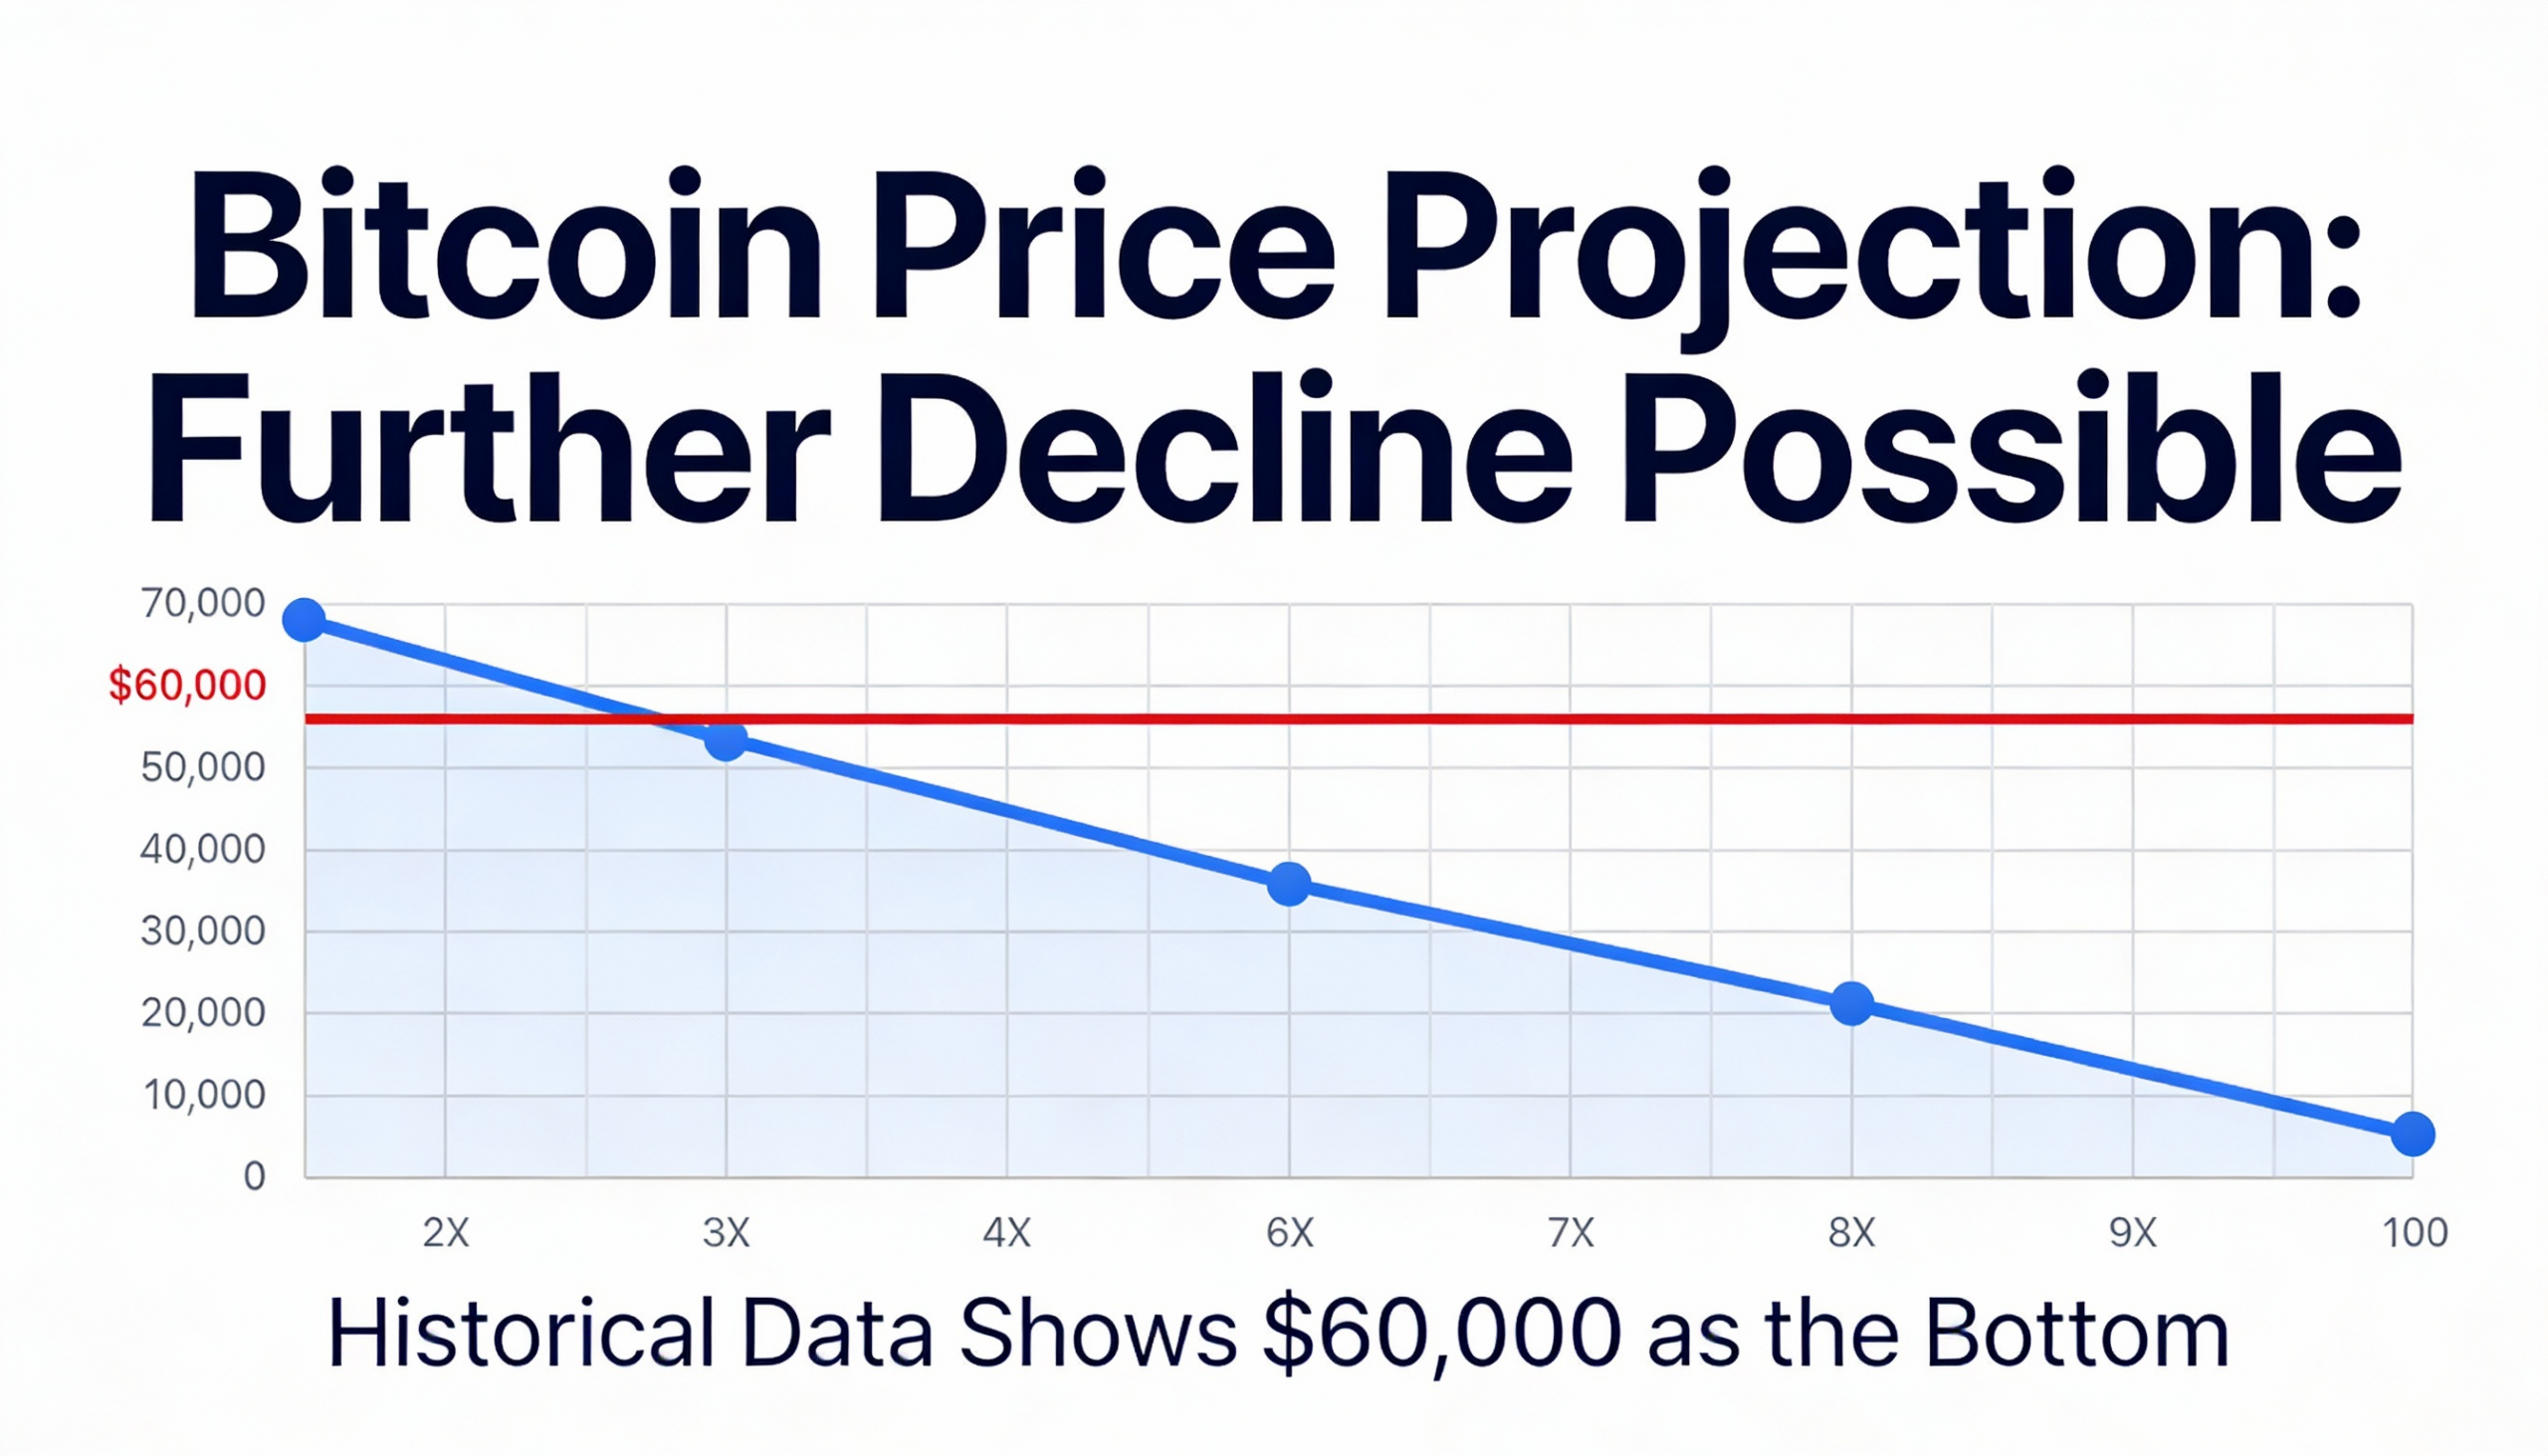
The cryptocurrency dropped 11% last week to around $74,800, its largest weekly decline since March 2025. While the selloff has already weighed on sentiment, technical signals suggest the correction may not be finished. A move toward $58,000—roughly 25% below current levels—would bring bitcoin back to its 200-week moving average, a level that has repeatedly acted as support during previous bear markets.
A lack of strong dip-buying following the decline has added to fears of a more prolonged downturn. In past cycles, bitcoin has rarely formed a durable bottom quickly, instead spending extended periods grinding lower or consolidating near key support levels.
The 200-week moving average, which tracks bitcoin’s average closing price over nearly four years, is widely regarded as a benchmark for long-term trend direction and a reference point for the asset’s four-year market cycle. In every prior cycle, the indicator has either marked or closely coincided with major market lows. It currently sits just under $58,000.
Bitcoin has historically peaked in the fourth quarter of the final year of its four-year cycle. In the current cycle, it reached a record high of $126,000 in October and has since declined by about 40%. Last week’s drop also pushed bitcoin below the Ichimoku Cloud on the weekly chart, a technical indicator used to gauge momentum, trend strength, and support.
Prices holding above the Ichimoku Cloud typically signal a strong bullish trend, while sustained moves below it point to weakening momentum and heightened downside risk. Bitcoin’s break below the cloud represents a bearish shift that, in past cycles, has coincided with the most severe phases of bear markets.
The broader price action continues to align with the four-year cycle theory linked to bitcoin’s halving schedule. The halving, which cuts new supply by 50% roughly every four years, has historically contributed to recurring boom-and-bust dynamics.
During the 2015 bear market, bitcoin consistently found support near the 200-week moving average at prices just above $200. In the 2018–2019 downturn, the same indicator, then near $3,000, again acted as a floor, aside from a brief breakdown during the Covid-related market shock in March 2020.
More recently, bitcoin fell below the 200-week moving average in June 2022, trading under $22,000 and remaining below the level for more than a year. The price did not reclaim the line until October 2023, reinforcing its importance as a long-term support marker.
While historical patterns provide no certainty, the combination of bitcoin’s move below the Ichimoku Cloud and its distance from the 200-week moving average suggests further downside may be possible before a durable bottom is established—likely near a level that has repeatedly anchored past bear markets.